Judge Audra R. Behne
FY 2016 - 2021, Los Angeles Immigration Court
Attorney General Jeff Sessions appointed Audra R. Behné to begin hearing cases in October2018. Judge Behné earned a Bachelor of Arts in 1992 from California State University,Northridge, and a Juris Doctor in 1995 from the Southwestern University School of Law. From2014 to 2018, she was senior pro bono coordinating attorney for Kids In Need of Defense in LosAngeles. From 2004 to 2018, she was an attorney in private practice. From 2001 to 2004, shewas an associate attorney for Fragomen, Del Rey, Bernsen & Loewy, LLP, in Los Angeles. From1996 to 2001, she was a senior attorney with Korenberg, Abramowitz & Feldun in Encino,California. Judge Behné is a member of the State Bar of California.
Deciding Asylum Cases
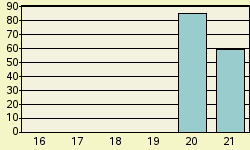
Detailed data on Judge Behne decisions were examined for the period covering fiscal years 2016 through 2021. During this period, Judge Behne is recorded as deciding 256 asylum claims on their merits. Of these, she granted 56, gave no conditional grants, and denied 200. Converted to percentage terms, Behne denied 78.1 percent and granted (including conditional grants) 21.9 percent. Figure 1 provides a comparison of Judge Behne's denial rate fiscal year-by-year over this recent period. (Rates for years with less than 25 decisions are not shown.)
Nationwide Comparisons
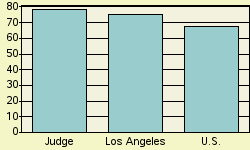
Compared to Judge Behne's denial rate of 78.1 percent, nationally during this same period, immigration court judges denied 67.6 percent of asylum claims. In the Los Angeles Immigration Court where Judge Behne was based, judges there denied asylum 75 percent of the time. See Figure 2.
Judge Behne can also be ranked compared to each of the 558 individual immigration judges serving during this period who rendered at least one hundred decisions in a city's immigration court. If judges were ranked from 1 to 558 - where 1 represented the highest denial percent and 558 represented the lowest - Judge Behne here receives a rank of 268. That is 267 judges denied asylum at higher rates, and 290 denied asylum at the same rate or less often. Ranks are tallied separately for each immigration court. Should a judge serve on more than one court during this period, separate ranks would be assigned in any court that the judge rendered at least 100 asylum decisions in.
Why Do Denial Rates Vary Among Judges?
Denial rates reflect in part the differing composition of cases assigned to different immigration judges. For example, being represented in court and the nationality of the asylum seeker appear to often impact decision outcome. Decisions also appear to reflect in part the personal perspective that the judge brings to the bench.
Representation
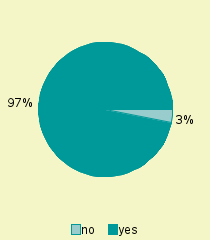
If an asylum seeker is not represented by an attorney, almost all (88%) of them are denied asylum. In contrast, a significantly higher proportion of represented asylum seekers are successful. In the case of Judge Behne, 2.7% were not represented by an attorney. See Figure 3. For the nation as a whole, about 18.3% of asylum seekers are not represented.
Nationality
Asylum seekers are a diverse group. Over one hundred different nationalities had at least one hundred individuals claiming asylum decided during this period. As might be expected, immigration courts located in different parts of the country tend to have proportionately larger shares from some countries than from others. And, given the required legal grounds for a successful asylum claim, asylum seekers from some nations tend to be more successful than others.
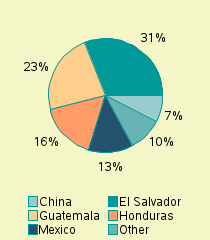
For Judge Behne, the largest group of asylum seekers appearing before her came from El Salvador. Individuals from this nation made up 30.9 % of her caseload. Other nationalities in descending order of frequency appearing before Judge Behne were: Guatemala (23 %), Honduras (16.4%), Mexico (12.5%), China (7.4%). See Figure 4.
In the nation as a whole during this same period, major nationalities of asylum seekers, in descending order of frequency, were El Salvador (18.7%), Guatemala (16.0%), Honduras (15.0%), Mexico (11.8%), China (8.4%), India (3.8%), Cuba (2.7%), Haiti (1.8%), Venezuela (1.6%), Cameroon (1.5%), Nicaragua (1.2%), Nepal (1.2%), Ecuador (1.1%).
