Judge Shifra Rubin
FY 2016 - 2021, Newark Immigration Court
Attorney General Loretta E. Lynch appointed Judge Rubin to begin hearing cases in January 2016. Judge Rubin received a Bachelor of Arts degree in 1992 from Rutgers University and a Juris Doctor in 2002 from Rutgers School of Law. From 2003 through 2015, Judge Rubin served in various capacities for the Immigration Representation Project, Legal Services of New Jersey, in Edison, N.J., including serving as a senior attorney, supervising attorney, and staff attorney. Judge Rubin is a member of the New Jersey Bar.
Deciding Asylum Cases
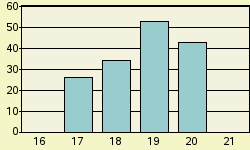
Detailed data on Judge Rubin decisions were examined for the period covering fiscal years 2016 through 2021. During this period, Judge Rubin is recorded as deciding 344 asylum claims on their merits. Of these, he granted 202, gave no conditional grants, and denied 142. Converted to percentage terms, Rubin denied 41.3 percent and granted (including conditional grants) 58.7 percent. Figure 1 provides a comparison of Judge Rubin's denial rate fiscal year-by-year over this recent period. (Rates for years with less than 25 decisions are not shown.)
Nationwide Comparisons
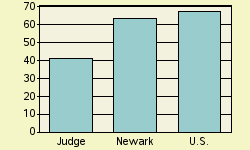
Compared to Judge Rubin's denial rate of 41.3 percent, nationally during this same period, immigration court judges denied 67.6 percent of asylum claims. In the Newark Immigration Court where Judge Rubin was based, judges there denied asylum 63.5 percent of the time. See Figure 2.
Judge Rubin can also be ranked compared to each of the 558 individual immigration judges serving during this period who rendered at least one hundred decisions in a city's immigration court. If judges were ranked from 1 to 558 - where 1 represented the highest denial percent and 558 represented the lowest - Judge Rubin here receives a rank of 476. That is 475 judges denied asylum at higher rates, and 82 denied asylum at the same rate or less often. Ranks are tallied separately for each immigration court. Should a judge serve on more than one court during this period, separate ranks would be assigned in any court that the judge rendered at least 100 asylum decisions in.
Why Do Denial Rates Vary Among Judges?
Denial rates reflect in part the differing composition of cases assigned to different immigration judges. For example, being represented in court and the nationality of the asylum seeker appear to often impact decision outcome. Decisions also appear to reflect in part the personal perspective that the judge brings to the bench.
Representation
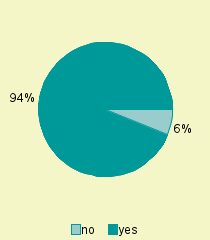
If an asylum seeker is not represented by an attorney, almost all (88%) of them are denied asylum. In contrast, a significantly higher proportion of represented asylum seekers are successful. In the case of Judge Rubin, 6.1% were not represented by an attorney. See Figure 3. For the nation as a whole, about 18.3% of asylum seekers are not represented.
Nationality
Asylum seekers are a diverse group. Over one hundred different nationalities had at least one hundred individuals claiming asylum decided during this period. As might be expected, immigration courts located in different parts of the country tend to have proportionately larger shares from some countries than from others. And, given the required legal grounds for a successful asylum claim, asylum seekers from some nations tend to be more successful than others.
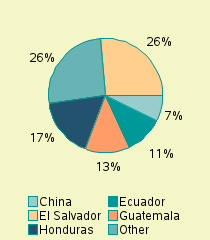
For Judge Rubin, the largest group of asylum seekers appearing before him came from El Salvador. Individuals from this nation made up 26.5 % of his caseload. Other nationalities in descending order of frequency appearing before Judge Rubin were: Honduras (16.9 %), Guatemala (12.8%), Ecuador (10.8%), China (7.3%). See Figure 4.
In the nation as a whole during this same period, major nationalities of asylum seekers, in descending order of frequency, were El Salvador (18.7%), Guatemala (16.0%), Honduras (15.0%), Mexico (11.8%), China (8.4%), India (3.8%), Cuba (2.7%), Haiti (1.8%), Venezuela (1.6%), Cameroon (1.5%), Nicaragua (1.2%), Nepal (1.2%), Ecuador (1.1%).
