Judge Howard E. Achtsam
FY 2016 - 2021, Harlingen Immigration Court
Judge Achtsam was appointed as an Immigration Judge in July 1986. He received a Bachelor of Arts degree from Queens College, City University of New York, in 1973, and a Juris Doctorate from the State University of New York at Buffalo, in 1976. Judge Achtsam worked as an attorney for the Law Offices of Jones and Crane in Weslaco, Texas, from 1984 to 1986. He was employed by the National Labor Relations Board (NLRB) in Albany, New York, as an attorney from 1976 to 1981. While employed by the NLRB, from 1976 to 1980, he worked for the Division of Advice Section in Washington, DC. He is a member of both the New York and Texas Bars.
Deciding Asylum Cases
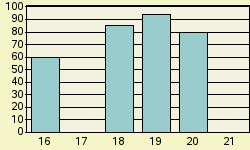
Detailed data on Judge Achtsam decisions were examined for the period covering fiscal years 2016 through 2021. During this period, Judge Achtsam is recorded as deciding 140 asylum claims on their merits. Of these, he granted 26, gave no conditional grants, and denied 114. Converted to percentage terms, Achtsam denied 81.4 percent and granted (including conditional grants) 18.6 percent. Figure 1 provides a comparison of Judge Achtsam's denial rate fiscal year-by-year over this recent period. (Rates for years with less than 25 decisions are not shown.)
Nationwide Comparisons
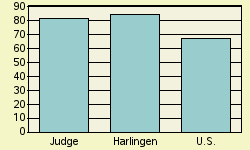
Compared to Judge Achtsam's denial rate of 81.4 percent, nationally during this same period, immigration court judges denied 67.6 percent of asylum claims. In the Harlingen Immigration Court where Judge Achtsam was based, judges there denied asylum 84.6 percent of the time. See Figure 2.
Judge Achtsam can also be ranked compared to each of the 558 individual immigration judges serving during this period who rendered at least one hundred decisions in a city's immigration court. If judges were ranked from 1 to 558 - where 1 represented the highest denial percent and 558 represented the lowest - Judge Achtsam here receives a rank of 234. That is 233 judges denied asylum at higher rates, and 324 denied asylum at the same rate or less often. Ranks are tallied separately for each immigration court. Should a judge serve on more than one court during this period, separate ranks would be assigned in any court that the judge rendered at least 100 asylum decisions in.
Why Do Denial Rates Vary Among Judges?
Denial rates reflect in part the differing composition of cases assigned to different immigration judges. For example, being represented in court and the nationality of the asylum seeker appear to often impact decision outcome. Decisions also appear to reflect in part the personal perspective that the judge brings to the bench.
Representation
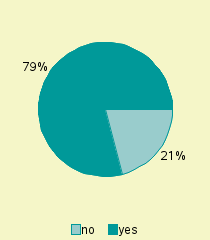
If an asylum seeker is not represented by an attorney, almost all (88%) of them are denied asylum. In contrast, a significantly higher proportion of represented asylum seekers are successful. In the case of Judge Achtsam, 21.4% were not represented by an attorney. See Figure 3. For the nation as a whole, about 18.3% of asylum seekers are not represented.
Nationality
Asylum seekers are a diverse group. Over one hundred different nationalities had at least one hundred individuals claiming asylum decided during this period. As might be expected, immigration courts located in different parts of the country tend to have proportionately larger shares from some countries than from others. And, given the required legal grounds for a successful asylum claim, asylum seekers from some nations tend to be more successful than others.

For Judge Achtsam, the largest group of asylum seekers appearing before him came from Mexico. Individuals from this nation made up 52.9 % of his caseload. Other nationalities in descending order of frequency appearing before Judge Achtsam were: Honduras (12.9 %), El Salvador (5.7%), Ethiopia (5.7%), Cuba (5%). See Figure 4.
In the nation as a whole during this same period, major nationalities of asylum seekers, in descending order of frequency, were El Salvador (18.7%), Guatemala (16.0%), Honduras (15.0%), Mexico (11.8%), China (8.4%), India (3.8%), Cuba (2.7%), Haiti (1.8%), Venezuela (1.6%), Cameroon (1.5%), Nicaragua (1.2%), Nepal (1.2%), Ecuador (1.1%).
