Judge Jeremiah Johnson
FY 2013 - 2018, San Francisco Immigration Court
Attorney General Jeff Sessions appointed Jeremiah Johnson to begin hearing cases inOctober 2017. Judge Johnson earned a Bachelor of Arts degree in 1996 from Randolph MaconCollege and a Juris Doctor in 2003 from the University of San Francisco School of Law. From2016 to 2017, he served as an asylum officer for the Department of Homeland Security, U.S.Citizenship and Immigration Services, in San Francisco. From 2011 to 2016, he was a partner atJohnson & McDermed LLP, in San Francisco. From 2005 to 2011, he was a partner at Reeves &Associates, in San Francisco. From 2004 to 2005, he was an attorney at the Law Offices ofShawn Sedaghat, in Los Angeles. From 2003 to 2004, he was a research attorney at Van DerHout, Brigagliano, & Nightingale LLP, in San Francisco. Judge Johnson is a member of theCalifornia State Bar.
Deciding Asylum Cases
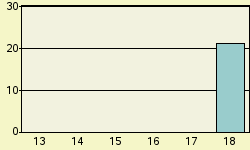
Detailed data on Judge Johnson decisions were examined for the period covering fiscal years 2013 through 2018. During this period, Judge Johnson is recorded as deciding 142 asylum claims on their merits. Of these, he granted 111, gave no conditional grants, and denied 31. Converted to percentage terms, Johnson denied 21.8 percent and granted (including conditional grants) 78.2 percent. Figure 1 provides a comparison of Judge Johnson's denial rate fiscal year-by-year over this recent period. (Rates for years with less than 25 decisions are not shown.)
Nationwide Comparisons
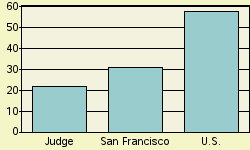
Compared to Judge Johnson's denial rate of 21.8 percent, nationally during this same period, immigration court judges denied 57.6 percent of asylum claims. In the San Francisco Immigration Court where Judge Johnson was based, judges there denied asylum 31.1 percent of the time. See Figure 2.
Judge Johnson can also be ranked compared to each of the 347 individual immigration judges serving during this period who rendered at least one hundred decisions in a city's immigration court. If judges were ranked from 1 to 347 - where 1 represented the highest denial percent and 347 represented the lowest - Judge Johnson here receives a rank of 307. That is 306 judges denied asylum at higher rates, and 40 denied asylum at the same rate or less often. Ranks are tallied separately for each immigration court. Should a judge serve on more than one court during this period, separate ranks would be assigned in any court that the judge rendered at least 100 asylum decisions in.
Why Do Denial Rates Vary Among Judges?
Denial rates reflect in part the differing composition of cases assigned to different immigration judges. For example, being represented in court and the nationality of the asylum seeker appear to often impact decision outcome. Decisions also appear to reflect in part the personal perspective that the judge brings to the bench.
Representation
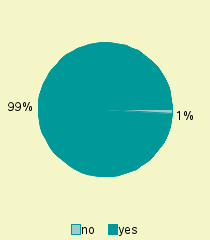
If an asylum seeker is not represented by an attorney, almost all (91%) of them are denied asylum. In contrast, a significantly higher proportion of represented asylum seekers are successful. In the case of Judge Johnson, 1.4% were not represented by an attorney. See Figure 3. For the nation as a whole, about 20% of asylum seekers are not represented.
Nationality
Asylum seekers are a diverse group. Over one hundred different nationalities had at least one hundred individuals claiming asylum decided during this period. As might be expected, immigration courts located in different parts of the country tend to have proportionately larger shares from some countries than from others. And, given the required legal grounds for a successful asylum claim, asylum seekers from some nations tend to be more successful than others.
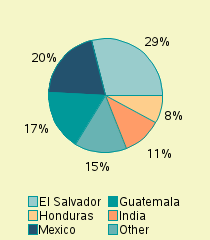
For Judge Johnson, the largest group of asylum seekers appearing before him came from El Salvador. Individuals from this nation made up 28.9 % of his caseload. Other nationalities in descending order of frequency appearing before Judge Johnson were: Mexico (20.4 %), Guatemala (16.9%), India (11.3%), Honduras (7.7%). See Figure 4.
In the nation as a whole during this same period, major nationalities of asylum seekers, in descending order of frequency, were China (18.5%), El Salvador (14.7%), Mexico (12.0%), Honduras (10.9%), Guatemala (10.3%), India (3.2%), Haiti (2.1%), Nepal (1.8%), Eritrea (1.3%), Ethiopia (1.3%), Somalia (1.2%), Cameroon (1.0%), Bangladesh (1.0%).