Judge Tammy L. Fitting
FY 2011 - 2016, Tacoma Immigration Court
Judge Fitting was appointed as an immigration judge in March 2008. She received a bachelor of arts degree in 1986 from the University of Idaho and a juris doctorate in 1989 from the University of Idaho, College of Law. From 2003 to March 2008, Judge Fitting served as assistant chief counsel, ICE, DHS, in Seattle. From 1990 to 2003, Judge Fitting was an assistant district counsel with the former INS, after entering on duty through the Attorney General's Honors Program. She is a member of the Washington and Idaho bars.
Deciding Asylum Cases
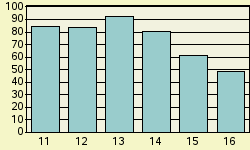
Detailed data on Judge Fitting decisions were examined for the period covering fiscal years 2011 through 2016. During this period, Judge Fitting is recorded as deciding 414 asylum claims on their merits. Of these, she granted 111, gave no conditional grants, and denied 303. Converted to percentage terms, Fitting denied 73.2 percent and granted (including conditional grants) 26.8 percent. Figure 1 provides a comparison of Judge Fitting's denial rate fiscal year-by-year over this recent period.
Nationwide Comparisons
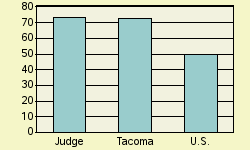
Compared to Judge Fitting's denial rate of 73.2 percent, nationally during this same period, immigration court judges denied 49.8 percent of asylum claims. In the Tacoma Immigration Court where Judge Fitting was based, judges there denied asylum 72.6 percent of the time. See Figure 2.
Judge Fitting can also be ranked compared to each of the 268 individual immigration judges serving during this period who rendered at least one hundred decisions in a city's immigration court. If judges were ranked from 1 to 268 - where 1 represented the highest denial percent and 268 represented the lowest - Judge Fitting here receives a rank of 100. That is 99 judges denied asylum at higher rates, and 168 denied asylum at the same rate or less often. Ranks are tallied separately for each immigration court. Should a judge serve on more than one court during this period, separate ranks would be assigned in any court that the judge rendered at least 100 asylum decisions in.
Why Do Denial Rates Vary Among Judges?
Denial rates reflect in part the differing composition of cases assigned to different immigration judges. For example, being represented in court and the nationality of the asylum seeker appear to often impact decision outcome. Decisions also appear to reflect in part the personal perspective that the judge brings to the bench.
Representation
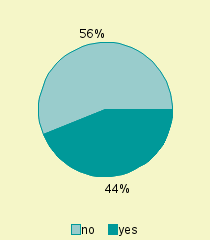
If an asylum seeker is not represented by an attorney, almost all (91%) of them are denied asylum. In contrast, a significantly higher proportion of represented asylum seekers are successful. In the case of Judge Fitting, 55.8% were not represented by an attorney. See Figure 3. For the nation as a whole, about 18.7% of asylum seekers are not represented.
Nationality
Asylum seekers are a diverse group. Over one hundred different nationalities had at least one hundred individuals claiming asylum decided during this period. As might be expected, immigration courts located in different parts of the country tend to have proportionately larger shares from some countries than from others. And, given the required legal grounds for a successful asylum claim, asylum seekers from some nations tend to be more successful than others.
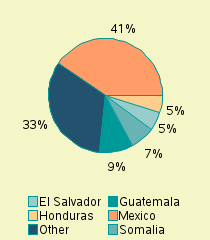
For Judge Fitting, the largest group of asylum seekers appearing before her came from Mexico. Individuals from this nation made up 40.6 % of her caseload. Other nationalities in descending order of frequency appearing before Judge Fitting were: Guatemala (9.4 %), Somalia (7%), El Salvador (5.3%), Honduras (4.8%). See Figure 4.
In the nation as a whole during this same period, major nationalities of asylum seekers, in descending order of frequency, were China (27.1%), Mexico (9.6%), El Salvador (9.2%), Guatemala (6.8%), Honduras (5.9%), India (2.9%), Nepal (2.2%), Ethiopia (2.1%), Eritrea (1.5%), Somalia (1.5%), Egypt (1.4%), Haiti (1.3%), Colombia (1.1%).