Judge John Milo Bryant
FY 2009 - 2014, Arlington Immigration Court
Judge Bryant was appointed as an Immigration Judge in July 1987. He received a Bachelor of Arts degree in 1972, and Master of Arts degree in 1973, both from Loyola University of Chicago. He received a Juris Doctorate from George Mason University School of Law in 1977. Prior to becoming an Immigration Judge, from 1983 to 1987, Judge Bryant was in private practice. From 1980 to 1982, he served as an attorney with the U.S. International Trade Commission in Washington, DC. He is a member of both the Virginia and District of Columbia Bars.
Deciding Asylum Cases
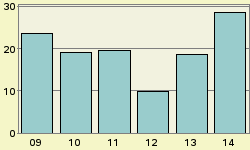
Detailed data on Judge Bryant decisions were examined for the period covering fiscal years 2009 through the first nine months of 2014. During this period, Judge Bryant is recorded as deciding 538 asylum claims on their merits. Of these, he granted 438, gave no conditional grants, and denied 100. Converted to percentage terms, Bryant denied 18.6 percent and granted (including conditional grants) 81.4 percent. Figure 1 provides a comparison of Judge Bryant's denial rate fiscal year-by-year over this recent period.
Nationwide Comparisons
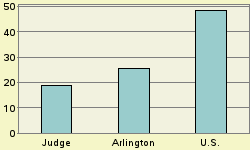
Compared to Judge Bryant's denial rate of 18.6 percent, nationally during this same period, immigration court judges denied 48.5 percent of asylum claims. In the Arlington Immigration Court where Judge Bryant was based, judges there denied asylum 25.5 percent of the time. See Figure 2.
Judge Bryant can also be ranked compared to each of the 270 individual immigration judges serving during this period who rendered at least one hundred decisions in a city's immigration court. If judges were ranked from 1 to 270 - where 1 represented the highest denial percent and 270 represented the lowest - Judge Bryant here receives a rank of 254. That is 253 judges denied asylum at higher rates, and 16 denied asylum at the same rate or less often. Ranks are tallied separately for each immigration court. Should a judge serve on more than one court during this period, separate ranks would be assigned in any court that the judge rendered at least 100 asylum decisions in.
Why Do Denial Rates Vary Among Judges?
Denial rates reflect in part the differing composition of cases assigned to different immigration judges. For example, being represented in court and the nationality of the asylum seeker appear to often impact decision outcome. Decisions also appear to reflect in part the personal perspective that the judge brings to the bench.
Representation
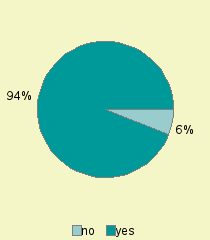
If an asylum seeker is not represented by an attorney, almost all (89%) of them are denied asylum. In contrast, a significantly higher proportion of represented asylum seekers are successful. In the case of Judge Bryant, 6.3% were not represented by an attorney. See Figure 3. For the nation as a whole, about 14.6% of asylum seekers are not represented.
Nationality
Asylum seekers are a diverse group. Over one hundred different nationalities had at least one hundred individuals claiming asylum decided during this period. As might be expected, immigration courts located in different parts of the country tend to have proportionately larger shares from some countries than from others. And, given the required legal grounds for a successful asylum claim, asylum seekers from some nations tend to be more successful than others.
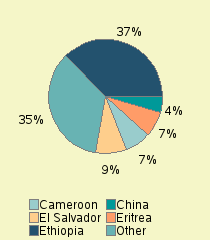
For Judge Bryant, the largest group of asylum seekers appearing before him came from Ethiopia. Individuals from this nation made up 37.4 % of his caseload. Other nationalities in descending order of frequency appearing before Judge Bryant were: El Salvador (8.7 %), Cameroon (7.2%), Eritrea (7.2%), China (4.5%). See Figure 4.
In the nation as a whole during this same period, major nationalities of asylum seekers, in descending order of frequency, were China (28.5%), El Salvador (6.8%), Mexico (5.9%), Guatemala (5.7%), Haiti (3.1%), Honduras (2.9%), India (2.7%), Ethiopia (2.5%), Colombia (2.2%), Nepal (2.1%), Indonesia (1.5%), Eritrea (1.5%), Venezuela (1.5%).