Judge Denise N. Slavin
FY 2006 - 2011, Miami - Krome Immigration Court
Judge Slavin was appointed as an Immigration Judge in April 1995. She received a Bachelor of Arts degree from the University of Maryland Baltimore County in 1977, and a Juris Doctorate from the University of Maryland at Baltimore Law School in 1982. From 1990 to 1995, she served as a senior trial attorney for the Office of Special Investigations, Criminal Division, Department of Justice, Washington, DC. From 1987 to 1990, she worked as a trial attorney with the former Immigration and Naturalization Service, Baltimore District Office. From 1982 to 1987, Judge Slavin served as an assistant general counsel and, from 1981 to 1982, as an intergroup relations representative (investigator) both with the Maryland Commission on Human Relations in Baltimore. Judge Slavin is a member of the Maryland Bar.
Deciding Asylum Cases
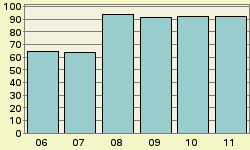
Detailed data on Judge Slavin decisions were examined for the period covering fiscal years 2006 through 2011 During this period, Judge Slavin is recorded as deciding 281 asylum claims on their merits. Of these, she granted 56, gave no conditional grants, and denied 225. Converted to percentage terms, Slavin denied 80.1 percent and granted (including conditional grants) 19.9 percent. Figure 1 provides a comparison of Judge Slavin's denial rate fiscal year-by-year over this recent period.
Nationwide Comparisons
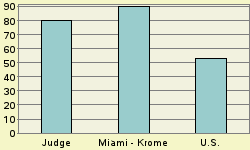
Compared to Judge Slavin's denial rate of 80.1 percent, nationally during this same period, immigration court judges denied 53.2 percent of asylum claims. In the Miami - Krome Immigration Court where Judge Slavin was based, judges there denied asylum 89.8 percent of the time. See Figure 2.
Judge Slavin can also be ranked compared to each of the 256 individual immigration judges serving during this period who rendered at least one hundred decisions in a city's immigration court. If judges were ranked from 1 to 256 - where 1 represented the highest denial percent and 256 represented the lowest - Judge Slavin here receives a rank of 46. That is 45 judges denied asylum at higher rates, and 210 denied asylum at the same rate or less often. Ranks are tallied separately for each immigration court. Should a judge serve on more than one court during this period, separate ranks would be assigned in any court that the judge rendered at least 100 asylum decisions in.
Why Do Denial Rates Vary Among Judges?
Denial rates reflect in part the differing composition of cases assigned to different immigration judges. For example, being represented in court and the nationality of the asylum seeker appear to often impact decision outcome. Decisions also appear to reflect in part the personal perspective that the judge brings to the bench.
Representation
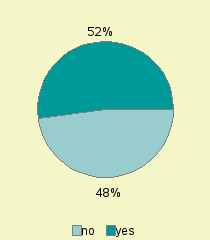
If an asylum seeker is not represented by an attorney, almost all (87%) of them are denied asylum. In contrast, a significantly higher proportion of represented asylum seekers are successful. In the case of Judge Slavin, 48.4% were not represented by an attorney. See Figure 3. For the nation as a whole, about 11.1% of asylum seekers are not represented.
Nationality
Asylum seekers are a diverse group. Over one hundred different nationalities had at least one hundred individuals claiming asylum decided during this period. As might be expected, immigration courts located in different parts of the country tend to have proportionately larger shares from some countries than from others. And, given the required legal grounds for a successful asylum claim, asylum seekers from some nations tend to be more successful than others.
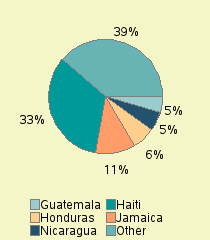
For Judge Slavin, the largest group of asylum seekers appearing before her came from Haiti. Individuals from this nation made up 33.5 % of her caseload. Other nationalities in descending order of frequency appearing before Judge Slavin were: Jamaica (11.4 %), Honduras (6.4%), Nicaragua (5.3%), Guatemala (4.6%). See Figure 4.
In the nation as a whole during this same period, major nationalities of asylum seekers, in descending order of frequency, were China (23.3%), Haiti (8.4%), El Salvador (5.9%), Colombia (5.5%), Guatemala (5.3%), Indonesia (2.9%), India (2.6%), Venezuela (2.5%), Ethiopia (2.1%), Albania (2%), Honduras (2%), Mexico (2%), Guinea (1.6%).