Judge Irma Lopez-Defillo
FY 2001 - 2006
Judge Lopez-Defillo was appointed as an Immigration Judge in May 1997. She received a Bachelor of Arts degree in 1978 from the University of Puerto Rico, and a Juris Doctorate in 1981 from the University of Puerto Rico Law School. From 1991 to 1997, Judge Lopez-Defillo served as assistant district counsel for the former Immigration and Naturalization Service in Hato Rey, Puerto Rico. She worked as an assistant federal public defender in San Juan, Puerto Rico, from 1984 to 1991. From 1982 to 1984, Judge Lopez-Defillo worked as a law clerk to a U.S. magistrate judge in Old San Juan, Puerto Rico. She served as attorney/legal advisor to the Governor of Puerto Rico on labor policy in Hato Rey from 1981 to 1982. Judge Lopez-Defillo is a member of the Puerto Rico Bar.
Deciding Asylum Cases
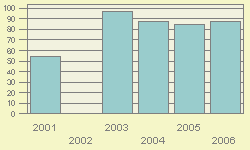
Detailed data on Judge Lopez-Defillo decisions are available for the period covering fiscal years 2001 through 2006. During this period, Judge Lopez-Defillo is recorded as deciding 231 asylum claims on their merits. Of these, she granted 39, gave no conditional grants, and denied 192. Converted to percentage terms, Lopez-Defillo denied 83.1 percent and granted (including conditional grants) 16.9 percent. Figure 1 provides a comparison of Judge Lopez-Defillo's denial rate fiscal year-by-year over this recent period. (Rates for years with less than 25 decisions are not shown.)
Nationwide Comparisons
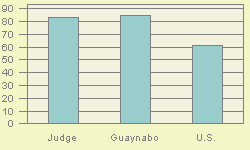
Compared to Judge Lopez-Defillo's denial rate of 83.1 percent, nationally during this same period, immigration court judges denied 60.8 percent of asylum claims. In the Guaynabo Immigration Court where Judge Lopez-Defillo was usually based, judges there denied asylum 84.3 percent of the time. See Figure 2.
Judge Lopez-Defillo can also be ranked compared to each of the 238 individual immigration judges serving during this period who rendered at least one hundred decisions. If judges were ranked from 1 to 238 - where 1 represented the highest denial percent and 238 represented the lowest - Judge Lopez-Defillo receives a rank of 39. That is 38 judges denied asylum at higher rates, and 199 denied asylum at the same rate or less often.
Why Do Denial Rates Vary Among Judges?
Denial rates reflect in part the differing composition of cases assigned to different immigration judges. For example, being represented in court and the nationality of the asylum seeker appear to often impact decision outcome. Decisions also appear to reflect in part the personal perspective that the judge brings to the bench.
Representation
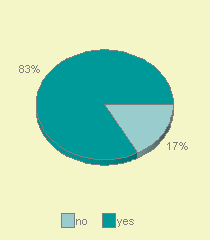
If an asylum seeker is not represented by an attorney, almost all (87%) of them are denied asylum. In contrast, a significantly higher proportion of represented asylum seekers are successful. In the case of Judge Lopez-Defillo, 16.9% were not represented by an attorney. See Figure 3. For the nation as a whole, about 8.2% of asylum seekers are not represented.
Nationality
Asylum seekers are a diverse group. Over one hundred different nationalities had at least one hundred individuals claiming asylum decided during this period. As might be expected, immigration courts located in different parts of the country tend to have proportionately larger shares from some countries than from others. And, given the required legal grounds for a successful asylum claim, asylum seekers from some nations tend to be more successful than others.
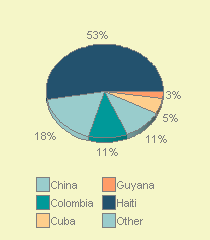
For Judge Lopez-Defillo, the largest group of asylum seekers appearing before her came from Haiti. Individuals from this nation made up 52.8 % of her caseload. Other nationalities in descending order of frequency appearing before Judge Lopez-Defillo were: China (17.7 %), Colombia (10.8%), Cuba (5.2%), Guyana (2.6%). See Figure 4.
In the nation as a whole during this same period, major nationalities of asylum seekers, in descending order of frequency, were China (22.3%), Colombia (10.2%), Haiti (9.9%), Albania (3.9%), Indonesia (3.8%), India (3.5%), Guatemala (3.1%), El Salvador (2.1%), Armenia (2.1%), Mexico (1.7%), Russia (1.6%), Ethiopia (1.6%), Pakistan (1.5%), and Cameroon (1.4%).