Judge Sandra S. Coleman
Judge Coleman was appointed Immigration Judge in June 1997. Prior to her appointment, she served as an attorney with the Office of the Counsel to the President. Judge Coleman received her B.S. in 1978 from Northern University, and her J.D. from the University of South Dakota in 1981. Judge Coleman worked as assistant director, United States Trustees, in Washington, DC, from 1992 to 1996. From 1982 to 1996, she served as deputy chief, Voting Section, Civil Rights Division in Washington, DC. She also served as director and deputy director of the Section 5 Unit of the Voting Section during this time. Judge Coleman's career with the Department of Justice began in 1981 when she was hired as a trial attorney through the Department's Honors Program. She also served as an adjunct instructor with the American University Washington College of Law, Washington, DC, from 1984 to 1986. Judge Coleman is a member of the South Dakota Bar.
Deciding Asylum Cases
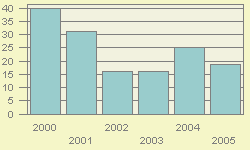
Detailed data on Judge Coleman decisions are available for the period covering fiscal year 2000 through the early months of 2005. During this period, Judge Coleman is recorded as deciding 1081 asylum claims on their merits. Of these, she granted 827, gave 12 conditional grants, and denied 242. Converted to percentage terms, Coleman denied 22.4 percent and granted (including conditional grants) 77.6 percent. Figure 1 provides a comparison of Judge Coleman 's denial rate fiscal year-by-year over this recent period.
Nationwide Comparisons
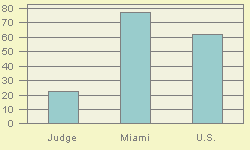
Compared to Judge Coleman 's denial rate of 22.4, nationally during this same period, immigration court judges denied 61.9 percent of asylum claims. In the Miami Immigration Court where Judge Coleman was usually based, judges there denied asylum 77.3 % of the time. See Figure 2.
Judge Coleman can also be ranked compared to each of the 224 individual immigration judges serving during this period who rendered at least one hundred decisions. If judges were ranked from 1 to 224 - where 1 represented the highest denial percent and 224 represented the lowest - Judge Coleman receives a rank of 219. That is 218 judges denied asylum at higher rates, and 5 denied asylum the at the same rate or less often.
Why Do Denial Rates Vary Among Judges?
Denial rates reflect in part the differing composition of cases assigned to different immigration judges. For example, being represented in court and the nationality of the asylum seeker appear to often impact decision outcome. Decisions also appear to reflect in part the personal perspective that the judge brings to the bench.
Representation
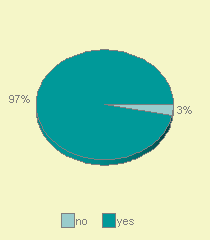
If an asylum seeker is not represented by an attorney, almost all (93%) of them are denied asylum. In contrast, a significantly higher proportion of represented asylum seekers are successful. In the case of Judge Coleman , 3.2 % were not represented by an attorney. See Figure 3. For the nation as a whole, about 9.2 % asylum seekers are not represented.
Nationality
Asylum seekers are a diverse group. Over one hundred different nationalities had at least one hundred individuals claiming asylum decided during this period. As might be expected, immigration courts located in different parts of the country tend to have proportionately larger shares from some countries than from others. And, given the required legal grounds for a successful asylum claim, asylum seekers from some nations tend to be more successful than others.
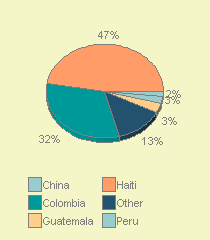
For Judge Coleman , the largest group of asylum seekers appearing before her came from Haiti . Individuals from this nation made up 47.3 % of her caseload. Other nationalities in descending order of frequency appearing before Judge Coleman were: Colombia (31.6 %), Guatemala (3.4%), Peru (2.6%), China (1.8%). See Figure 4.
In the nation as a whole during this same period, major nationalities of asylum seekers, in descending order of frequency, were China (22.3%), Haiti (9.3%), Colombia (9.1%), Albania (4.0%), India (3.9%), Guatemala (3.4%), Indonesia (3.0%), El Salvador (2.4%), Armenia (2.1%), Mexico (1.9%), and Russia (1.9%).