Judge Jeffrey Zlatow
Judge Zlatow was appointed as an Immigration Judge in July 1987. Prior to his appointment to the Eloy Immigration Court in March 2001, he served as an Immigration Judge at the Immigration Court in New Orleans, Louisiana, from July 1987 to March 2001. Judge Zlatow received a Bachelor of Arts degree in 1975 (cum laude), and a Juris Doctorate in 1979 (cum laude), both from the University of Wisconsin at Madison. From 1981 to 1987, he worked in private practice in San Francisco where he concentrated on immigration law. From 1980 to 1981, he worked as an attorney with the Law Offices of Fallon, Hargreaves, Bixby & McVey, also in San Francisco. From 1979 to 1980, Judge Zlatow served as an assistant district attorney in Menomonie, Wisconsin. He is a member of both the Wisconsin and California Bars.
Deciding Asylum Cases
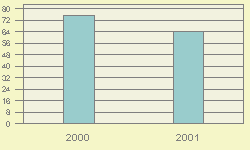
Detailed data on Judge Zlatow decisions are available for the period covering fiscal year 2000 through the early months of 2005. During this period, Judge Zlatow is recorded as deciding 149 asylum claims on their merits. Of these, he granted 23, gave 4 conditional grants, and denied 122. Converted to percentage terms, Zlatow denied 81.9 percent and granted (including conditional grants) 18.1 percent. Figure 1 provides a comparison of Judge Zlatow 's denial rate fiscal year-by-year over this recent period.
Nationwide Comparisons
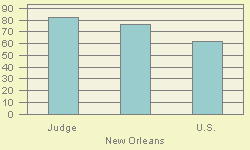
Compared to Judge Zlatow 's denial rate of 81.9, nationally during this same period, immigration court judges denied 61.9 percent of asylum claims. In the New Orleans Immigration Court where Judge Zlatow was usually based, judges there denied asylum 76 % of the time. See Figure 2.
Judge Zlatow can also be ranked compared to each of the 224 individual immigration judges serving during this period who rendered at least one hundred decisions. If judges were ranked from 1 to 224 - where 1 represented the highest denial percent and 224 represented the lowest - Judge Zlatow receives a rank of 46. That is 45 judges denied asylum at higher rates, and 178 denied asylum the at the same rate or less often.
Why Do Denial Rates Vary Among Judges?
Denial rates reflect in part the differing composition of cases assigned to different immigration judges. For example, being represented in court and the nationality of the asylum seeker appear to often impact decision outcome. Decisions also appear to reflect in part the personal perspective that the judge brings to the bench.
Representation
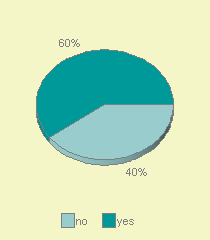
If an asylum seeker is not represented by an attorney, almost all (93%) of them are denied asylum. In contrast, a significantly higher proportion of represented asylum seekers are successful. In the case of Judge Zlatow , 40.3 % were not represented by an attorney. See Figure 3. For the nation as a whole, about 9.2 % asylum seekers are not represented.
Nationality
Asylum seekers are a diverse group. Over one hundred different nationalities had at least one hundred individuals claiming asylum decided during this period. As might be expected, immigration courts located in different parts of the country tend to have proportionately larger shares from some countries than from others. And, given the required legal grounds for a successful asylum claim, asylum seekers from some nations tend to be more successful than others.
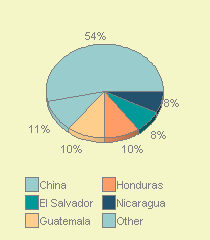
For Judge Zlatow , the largest group of asylum seekers appearing before him came from China . Individuals from this nation made up 10.7 % of his caseload. Other nationalities in descending order of frequency appearing before Judge Zlatow were: Guatemala (10.4 %), Honduras (9.8%), El Salvador (7.6%), Nicaragua (7.6%). See Figure 4.
In the nation as a whole during this same period, major nationalities of asylum seekers, in descending order of frequency, were China (22.3%), Haiti (9.3%), Colombia (9.1%), Albania (4.0%), India (3.9%), Guatemala (3.4%), Indonesia (3.0%), El Salvador (2.4%), Armenia (2.1%), Mexico (1.9%), and Russia (1.9%).