How Many Pending Deportation Cases are There in Your State? TRAC's Updated Mapping Tool Has the Answer
According to Immigration Court data obtained by TRAC, the total immigration court backlog is currently 1,337,372 pending cases. However, those cases are not distributed evenly across the country and representation rates — one of the most important factors in case outcomes — varies widely.
For the first time since February 2019, TRAC has been able to update its interactive map of immigration cases and rates of attorney representation, which allows the public to visualize the distribution of cases and representation rates across the country for cases pending at the end of May 2021. Records were obtained through requests made by the Transactional Records Access Clearinghouse (TRAC) at Syracuse University under the Freedom of Information Act to the Executive Office for Immigration Review (EOIR), the agency that oversees the Immigration Court system.
Immigration Court Cases Vary by State
The total number of pending deportation cases varies from state to state.[1] The residents of four states — California, Texas, New York, and Florida — have over 100,000 pending deportation cases each. New Jersey and Virginia each have over 50,000 pending cases, while another 19 states have between 10,000 and 50,000 cases. Several states — North Dakota, Wyoming, West Virginia, Hawaii, Vermont, Alaska, and Montana — have less than 1,000 pending cases. See Figure 1 and Table 1.
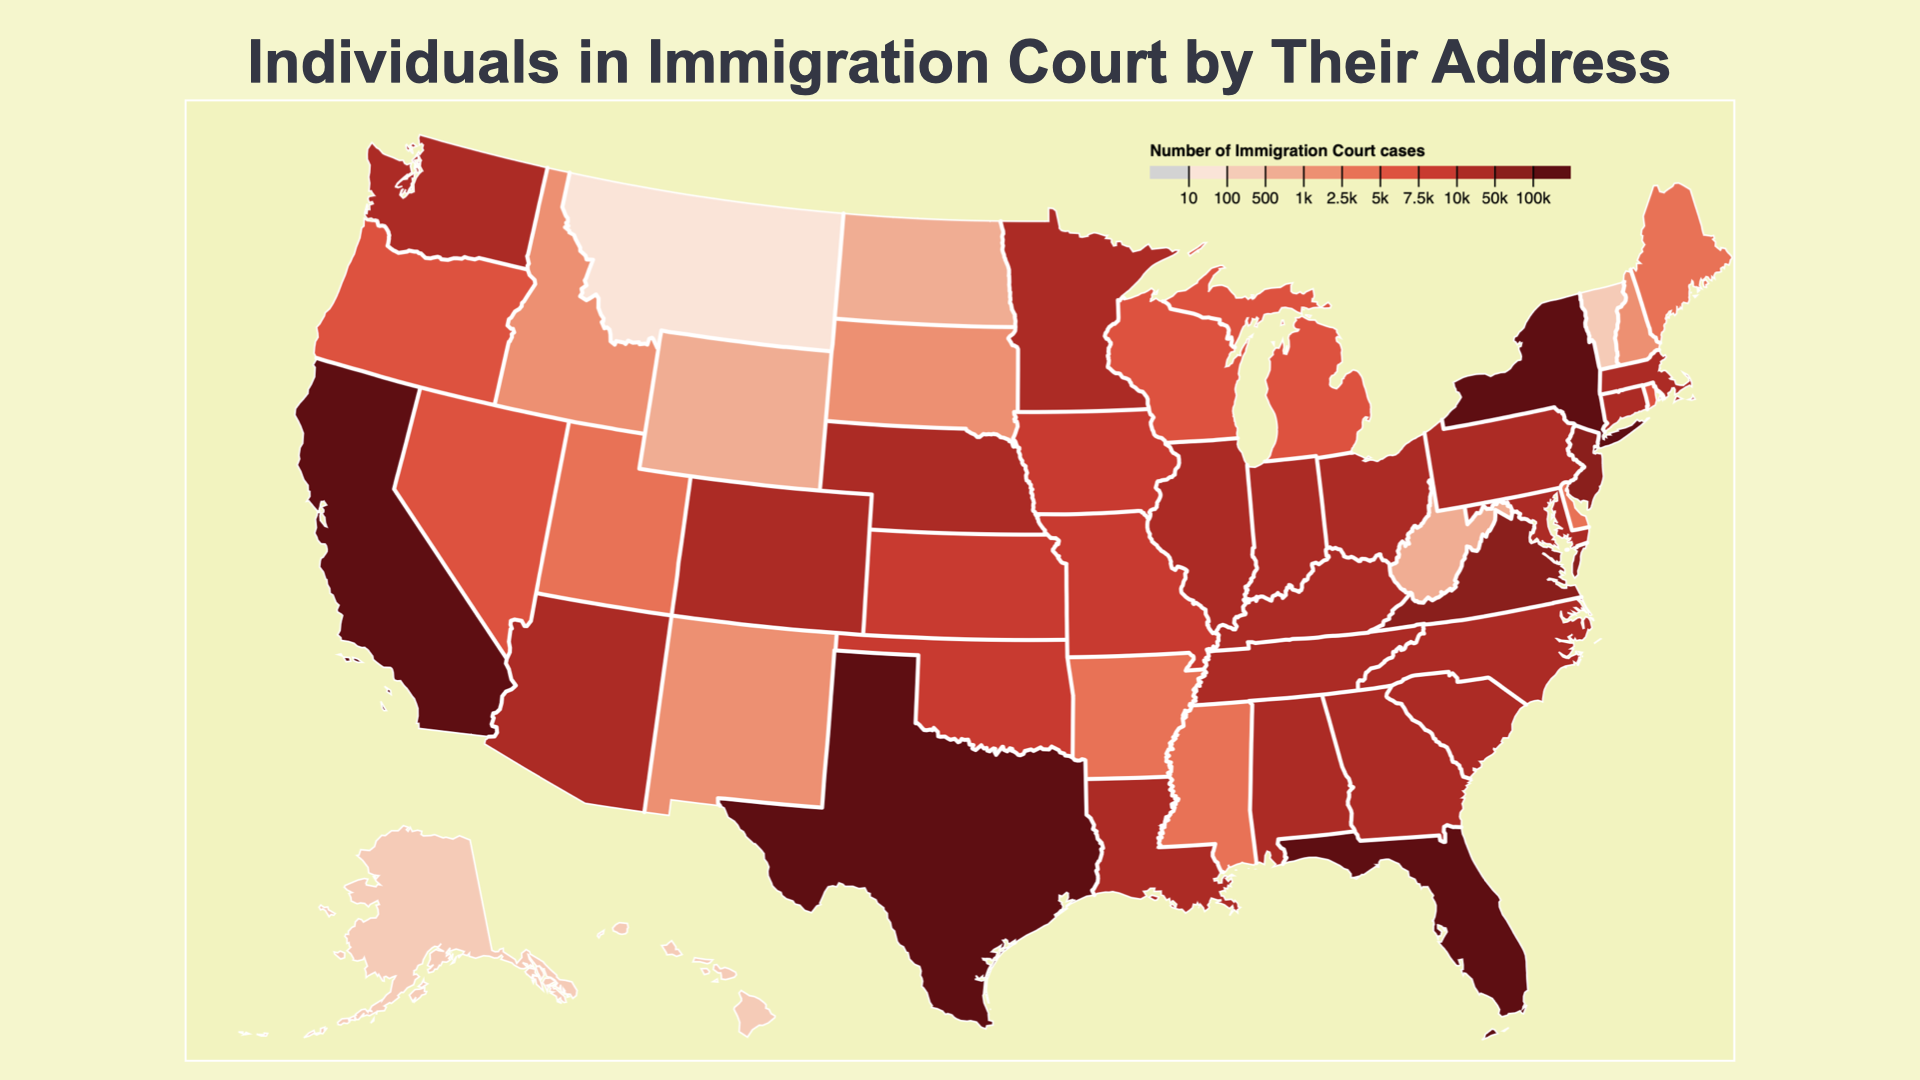
(Click for larger image)
It is not surprising that more populous states have more pending cases, and less populous states have fewer. A somewhat different picture emerges when states are compared by the number of pending Immigration Court cases relative to their population size. Using the most recent state-level population counts from the U.S. Census Bureau, TRAC calculated the number of deportation cases per 100,000 residents. [2] These results are also displayed in Table 1.
Many of the states with large numbers of pending deportation cases also have high rates of deportation cases relative to their population. The following states are in the top 10 on both rankings: Texas, New York, Florida, New Jersey, Virginia, Massachusetts, and Maryland. However, on deportation cases per 100,000, Rhode Island, Washington D.C., and Nebraska move into the top 10, while California, Georgia, and North Carolina drop below the top 10. See Table 1.
Nebraska is a particularly interesting state, the only state not located on a coast or on the U.S.-Mexico border in the top 10. Note that the top 10 states by rates of pending deportation cases are all over 500 per 100,000.
Several states change rank order significantly between total number of cases and the number of cases relative to population. Washington, D.C., for instance, is 37th in the country in total cases but 8th on a per capita basis. Rhode Island also makes a similar jump upward in the rankings from 32nd to 5th. Other states move in the opposite direction. Ohio ranks 17th in total pending deportation cases but 37th per capita, and Illinois also moves from 11th down to 30th respectively. A few border states also see a similar trend. California has the most total pending deportation cases, but moves to 11th relative to population, Texas moves from 2nd to 9th, and Arizona moves from 19th to 31st respectively. New Mexico, however, remains in 41st on both rankings. See Table 1.
| State | Population* | Pending Cases | Rate** | Rank on Cases | Rank on Rate** |
| California | 39,538,223 | 193,212 | 489 | 1 | 11 |
| Texas | 29,145,505 | 171,579 | 589 | 2 | 9 |
| New York | 20,201,249 | 149,912 | 742 | 3 | 2 |
| Florida | 21,538,187 | 136,430 | 633 | 4 | 6 |
| New Jersey | 9,288,994 | 71,720 | 772 | 5 | 1 |
| Virginia | 8,631,393 | 57,833 | 670 | 6 | 4 |
| Massachusetts | 7,029,917 | 47,497 | 676 | 7 | 3 |
| Georgia | 10,711,908 | 40,421 | 377 | 8 | 15 |
| Maryland | 6,177,224 | 37,747 | 611 | 9 | 7 |
| North Carolina | 10,439,388 | 34,883 | 334 | 10 | 17 |
| Illinois | 12,812,508 | 27,039 | 211 | 11 | 30 |
| Pennsylvania | 13,002,700 | 24,540 | 189 | 12 | 32 |
| Tennessee | 6,910,840 | 23,337 | 338 | 13 | 16 |
| Louisiana | 4,657,757 | 21,624 | 464 | 14 | 12 |
| Washington | 7,705,281 | 18,467 | 240 | 15 | 24 |
| Indiana | 6,785,528 | 17,961 | 265 | 16 | 20 |
| Ohio | 11,799,448 | 16,350 | 139 | 17 | 37 |
| Colorado | 5,773,714 | 15,578 | 270 | 18 | 19 |
| Arizona | 7,151,502 | 14,907 | 208 | 19 | 31 |
| Connecticut | 3,605,944 | 13,922 | 386 | 20 | 14 |
| South Carolina | 5,118,425 | 12,730 | 249 | 21 | 22 |
| Minnesota | 5,706,494 | 12,264 | 215 | 22 | 29 |
| Kentucky | 4,505,836 | 11,550 | 256 | 23 | 21 |
| Alabama | 5,024,279 | 11,411 | 227 | 24 | 27 |
| Nebraska | 1,961,504 | 10,375 | 529 | 25 | 10 |
| Oklahoma | 3,959,353 | 8,779 | 222 | 26 | 28 |
| Kansas | 2,937,880 | 8,281 | 282 | 27 | 18 |
| Iowa | 3,190,369 | 7,873 | 247 | 28 | 23 |
| Missouri | 6,154,913 | 7,542 | 123 | 29 | 38 |
| Nevada | 3,104,614 | 7,295 | 235 | 30 | 25 |
| Oregon | 4,237,256 | 7,192 | 170 | 31 | 34 |
| Rhode Island | 1,097,379 | 7,115 | 648 | 32 | 5 |
| Michigan | 10,077,331 | 7,114 | 71 | 33 | 45 |
| Wisconsin | 5,893,718 | 5,875 | 100 | 34 | 43 |
| Arkansas | 3,011,524 | 4,882 | 162 | 35 | 35 |
| Mississippi | 2,961,279 | 4,713 | 159 | 36 | 36 |
| District Of Columbia | 689,545 | 4,125 | 598 | 37 | 8 |
| Delaware | 989,948 | 4,011 | 405 | 38 | 13 |
| Utah | 3,271,616 | 3,441 | 105 | 39 | 40 |
| Maine | 1,362,359 | 2,557 | 188 | 40 | 33 |
| New Mexico | 2,117,522 | 2,221 | 105 | 41 | 41 |
| South Dakota | 886,667 | 2,025 | 228 | 42 | 26 |
| New Hampshire | 1,377,529 | 1,520 | 110 | 43 | 39 |
| Idaho | 1,839,106 | 1,230 | 67 | 44 | 46 |
| North Dakota | 779,094 | 623 | 80 | 45 | 44 |
| Wyoming | 576,851 | 580 | 101 | 46 | 42 |
| West Virginia | 1,793,716 | 573 | 32 | 47 | 47 |
| Hawaii | 1,455,271 | 325 | 22 | 48 | 49 |
| Vermont | 643,077 | 169 | 26 | 49 | 48 |
| Alaska | 733,391 | 101 | 14 | 50 | 50 |
| Montana | 1,084,225 | 95 | 9 | 51 | 51 |
| Other Cases*** | - | 43,826 | na | - | - |
| Total Backlog | 331,449,281 | 1,337,372 | 403 | - | - |
Representation Rates Vary Widely from State to State
Access to an attorney is one of the most important factors in case outcomes.[3] As TRAC has shown in the past, representation rates often fluctuate over time, between courts, and can be affected by policies such as MPP. Table 2 below shows the rates of representation for each of the 50 states and Washington, D.C. Both the representation rates for all pending cases and the representation rates for cases filed during the last 90 days are shown.
New York and California, which both have among the very highest number of pending deportation cases also have very high rates of representation relative to other states in the country at 79 percent and 77 percent respectively. Arizona, a border state, is also high relative to other states with 76 percent of cases showing attorney representation. Hawaii, with relatively few pending cases, had the highest representation rate at 83 percent. These representation rates should be taken into account when interpreting related data, for instance in TRAC's asylum tool which show that rates of asylum approval are typically much higher in New York than other states.
However, some states that also have high total numbers of deportation cases and also have high numbers of cases relative to the population have much lower rates of attorney representation. Just 48 percent of cases in Florida and 46 percent of cases in Texas have representation — less than half for two of the states with the most total cases. Georgia is even lower with just 39 percent representation. North Carolina and South Carolina are at the bottom of the list, each with less than 1 in 4 cases showing attorney representation. Notably, North Carolina is 10th overall in the country for total pending deportation cases, but last for representation. According to Immigration Court data through May 2021, North Carolina includes 26,701 deportation cases without attorney representation.
| State | All Pending Cases | Cases Filed in the Past 90 Days | ||||
| Number | Represented | Odds of Representation | Number | Represented | Odds of Representation | |
| Hawaii | 325 | 270 | 83.1% | 18 | 2 | 11.1% |
| New York | 149,912 | 118,915 | 79.3% | 3,228 | 661 | 20.5% |
| California | 193,212 | 148,932 | 77.1% | 4,204 | 925 | 22.0% |
| Michigan | 7,114 | 5,476 | 77.0% | 167 | 48 | 28.7% |
| Arizona | 14,907 | 11,311 | 75.9% | 786 | 249 | 31.7% |
| Wyoming | 580 | 433 | 74.7% | 12 | 4 | 33.3% |
| Utah | 3,441 | 2,522 | 73.3% | 232 | 65 | 28.0% |
| Nevada | 7,295 | 5,296 | 72.6% | 368 | 69 | 18.8% |
| Maryland | 37,747 | 27,189 | 72.0% | 496 | 96 | 19.4% |
| Iowa | 7,873 | 5,569 | 70.7% | 262 | 27 | 10.3% |
| Colorado | 15,578 | 10,899 | 70.0% | 530 | 64 | 12.1% |
| Nebraska | 10,375 | 7,185 | 69.3% | 457 | 47 | 10.3% |
| New Hampshire | 1,520 | 1,052 | 69.2% | 25 | 7 | 28.0% |
| Minnesota | 12,264 | 8,385 | 68.4% | 407 | 49 | 12.0% |
| Alaska | 101 | 69 | 68.3% | 2 | 0 | 0.0% |
| Virginia | 57,833 | 39,484 | 68.3% | 778 | 88 | 11.3% |
| Rhode Island | 7,115 | 4,831 | 67.9% | 91 | 26 | 28.6% |
| Washington | 18,467 | 12,535 | 67.9% | 261 | 42 | 16.1% |
| District Of Columbia | 4,125 | 2,789 | 67.6% | 41 | 6 | 14.6% |
| Ohio | 16,350 | 11,050 | 67.6% | 254 | 109 | 42.9% |
| Idaho | 1,230 | 830 | 67.5% | 37 | 15 | 40.5% |
| Vermont | 169 | 114 | 67.5% | 1 | 0 | 0.0% |
| Illinois | 27,039 | 18,004 | 66.6% | 920 | 177 | 19.2% |
| Delaware | 4,011 | 2,637 | 65.7% | 92 | 6 | 6.5% |
| Indiana | 17,961 | 11,520 | 64.1% | 558 | 141 | 25.3% |
| Wisconsin | 5,875 | 3,732 | 63.5% | 145 | 24 | 16.6% |
| Oregon | 7,192 | 4,548 | 63.2% | 158 | 6 | 3.8% |
| New Jersey | 71,720 | 44,704 | 62.3% | 762 | 287 | 37.7% |
| Pennsylvania | 24,540 | 15,110 | 61.6% | 685 | 116 | 16.9% |
| North Dakota | 623 | 383 | 61.5% | 26 | 5 | 19.2% |
| South Dakota | 2,025 | 1,209 | 59.7% | 147 | 7 | 4.8% |
| West Virginia | 573 | 339 | 59.2% | 9 | 0 | 0.0% |
| Arkansas | 4,882 | 2,848 | 58.3% | 71 | 19 | 26.8% |
| Massachusetts | 47,497 | 26,673 | 56.2% | 1,256 | 210 | 16.7% |
| Mississippi | 4,713 | 2,590 | 55.0% | 82 | 15 | 18.3% |
| Montana | 95 | 52 | 54.7% | 5 | 1 | 20.0% |
| Kentucky | 11,550 | 6,190 | 53.6% | 434 | 42 | 9.7% |
| New Mexico | 2,221 | 1,186 | 53.4% | 336 | 97 | 28.9% |
| Missouri | 7,542 | 3,845 | 51.0% | 340 | 16 | 4.7% |
| Tennessee | 23,337 | 11,701 | 50.1% | 378 | 63 | 16.7% |
| Florida | 136,430 | 65,007 | 47.6% | 4,100 | 655 | 16.0% |
| Texas | 171,579 | 78,491 | 45.7% | 5,982 | 719 | 12.0% |
| Kansas | 8,281 | 3,734 | 45.1% | 311 | 27 | 8.7% |
| Maine | 2,557 | 1,151 | 45.0% | 25 | 7 | 28.0% |
| Connecticut | 13,922 | 6,014 | 43.2% | 549 | 40 | 7.3% |
| Louisiana | 21,624 | 8,605 | 39.8% | 1,559 | 385 | 24.7% |
| Georgia | 40,421 | 15,720 | 38.9% | 1,498 | 159 | 10.6% |
| Alabama | 11,411 | 4,421 | 38.7% | 203 | 15 | 7.4% |
| Oklahoma | 8,779 | 2,450 | 27.9% | 103 | 14 | 13.6% |
| South Carolina | 12,730 | 3,160 | 24.8% | 256 | 25 | 9.8% |
| North Carolina | 34,883 | 8,182 | 23.5% | 556 | 53 | 9.5% |
| Subtotal | 1,293,546 | 779,342 | 60.2% | 34,203 | 5,930 | 17.3% |
| Cases Not Mapped* | 43,826 | - | - | - | - | - |
| Total Backlog | 1,337,372 | - | - | - | - | - |
Counties With Large Numbers of Pending Deportation Cases
Out of more than 3,100 counties in the United States, 25 counties have more than 10,000 pending cases. At the top of the list are counties in California, Texas, New York, and Florida — states that are consistently at the top of these rankings. A cautionary note: in the immigration court records, immigrants facing deportation who are detained will likely show the county of residence as the county of the detention facility. However, given the large numbers of pending deportation cases in these counties relative to the capacity of detention centers, detention alone cannot account for these large numbers. Table 3 below shows the 25 counties with more than 10,000 pending deportation cases and the percent of cases represented by an attorney.
See county details in TRAC's app that covers all court pending cases for respective numbers for every county in the United States.
| State* | County* | Pending Cases | Represented | Percent Represented |
| California | Los Angeles County | 71,894 | 54,811 | 76.2% |
| Texas | Harris County | 63,347 | 35,429 | 55.9% |
| New York | Queens County | 42,621 | 35,196 | 82.6% |
| Florida | Miami-Dade County | 36,469 | 17,953 | 49.2% |
| Texas | Dallas County | 28,016 | 7,714 | 27.5% |
| New York | Kings County | 27,056 | 21,210 | 78.4% |
| New York | Suffolk County | 20,507 | 16,367 | 79.8% |
| New York | Nassau County | 16,449 | 13,065 | 79.4% |
| Illinois | Cook County | 16,223 | 10,544 | 65.0% |
| Virginia | Fairfax County | 15,894 | 11,138 | 70.1% |
| Massachusetts | Middlesex County | 15,102 | 7,308 | 48.4% |
| Florida | Palm Beach County | 15,083 | 8,177 | 54.2% |
| Florida | Orange County | 14,424 | 6,119 | 42.4% |
| Florida | Broward County | 13,779 | 7,345 | 53.3% |
| New York | Bronx County | 13,498 | 9,968 | 73.8% |
| California | Alameda County | 13,358 | 10,724 | 80.3% |
| Maryland | Prince George's County | 12,969 | 9,473 | 73.0% |
| Texas | Travis County | 12,489 | 4,587 | 36.7% |
| New Jersey | Essex County | 11,748 | 7,144 | 60.8% |
| Arizona | Maricopa County | 11,619 | 9,209 | 79.3% |
| California | Orange County | 11,443 | 8,890 | 77.7% |
| North Carolina | Mecklenburg County | 10,882 | 2,196 | 20.2% |
| Massachusetts | Suffolk County | 10,489 | 6,608 | 63.0% |
| Pennsylvania | Philadelphia County | 10,375 | 6,015 | 58.0% |
| Georgia | Gwinnett County | 10,190 | 4,390 | 43.1% |
Footnotes
[1] Readers should keep in mind three important points about this data. First, the geographic location used here is based upon the postal address (zip code) listed in the court records for each individual with a pending case, not the location of the court or hearing location which could be in a different state. Second, it includes all pending cases in the backlog, consistent with TRAC's backlog tool. Thus, a small number of other case types which aren't strictly speaking deportation cases are included. Third, out of the total 1,337,372 pending cases, 43,826 cases (or 3.27% of the total) are not covered. Because the map does not cover locations outside the U.S. it does not include Puerto Rico or the Northern Mariana Islands where Immigration Courts are located. In addition, it doesn't include immigrants residing in other locations outside the United States. About one third of these cases reflect immigrants with a foreign address. For the remaining two thirds, court records TRAC received did not include any address, or the entries contained typos or otherwise weren't a valid zip code. This reflected in part the large number of immigrants required to remain in Mexico who may not have had any real address where mail could be sent. EOIR has also acknowledged to TRAC that there have been a significant number of data entry errors on the part of Court personnel so that invalid zip codes may have been inadvertently entered. Finally, the EOIR to prevent indirect identification also redacts zip codes with three or fewer occurrences from the files TRAC receives.
[2] The U.S. Census Bureau released population counts for states to meet the government's need for apportionment, which is the method for allocating seats in the House of Representatives to each of the 50 states based on population. State population counts were obtained from Table 2 on this webpage: https://www.census.gov/data/tables/2020/dec/2020-apportionment-data.html. At the time of this report, the Census Bureau has not released population counts from the 2020 Census for other geographic units, such as counties. For reference, county-level population information can be obtained based on estimates for 2019 here: https://www.census.gov/quickfacts/fact/table/US/PST045219.
[3] For a thorough analysis that drew on TRAC's detailed data by the authors when they served as TRAC Fellows, see: Eagly, I., & Shafer, S. (2015). A National Study of Access to Counsel in Immigration Court. University of Pennsylvania Law Review, 164(1), 1-91.