MPP Transfers Into United States Slow and Nationality Inequities Emerge
As of the end of May 2021, a total of 10,375 individuals formerly forced to remain in Mexico under the Migrant Protection Protocols (MPP) have been able to enter the United States since President Biden ended this Trump-era program.[1] Rather than accelerating in May, however, the pace of recorded transfers actually appears to have dramatically slowed.
During April, a total of 4,476 MPP cases had been processed and assigned to regular Immigration Courts within the U.S. This fell to just 1,988 during the month of May. The Department of Homeland Security claims that there has been no change in policy and that the pace of transfers is determined by "our capacity to safely process" MPP cases through ports of entry. However, this does not explain or address why either the "capacity" or actual recorded transfers have been suddenly reduced by more than half.[2]
These findings come from analyses conducted by the Transactional Records Access Clearinghouse (TRAC) at Syracuse University. Results are based on comparing MPP court records at the end of January 2021 matched with those from the end of May 2021. TRAC analyzed this matched MPP case cohort to track the Biden administration's phased process of allowing individuals entry into the U.S.
According to court records, as of the end of May, a total of 16,138 individuals with pending MPP cases still are required to remain in Mexico (or elsewhere outside the U.S.) and have not yet been allowed to enter this country.
The slowing of the transfer pace during May was unexpected because the fraction of MPP cases paroled into the country remains small compared to the total number of possible MPP cases. In fact, just under 40 percent of possible MPP cases have been transferred out of MPP courts according to court data.
Since these results are based entirely on court records, it is possible that more MPP individuals have been paroled into the U.S. if the Immigration Court has fallen behind in recording the receipt of transferred cases to their new hearing locations within the U.S. However, these figures seem in line with those tracked at the border by the United Nations High Commissioner for Refugees.[3]
It would not be surprising if there has been some recording delay. The court already faces a huge backlog of cases and clogged dockets — a situation that grew two and a half times worse during the Trump Administration. Backlogs have continued to increase during the first four months of the Biden Administration. As of the end of May the backlog totaled 1,337,372 cases — up 42,575 cases since the end of January.
It is also possible that the declining rate of MPP cases allowed into the country reflects the limitations that the UNHCR faces when trying to contact migrants who were waiting in dangerous conditions near the border with possibly unreliable communication between the courts and migrants.
Pace of Transfers Varied by Location
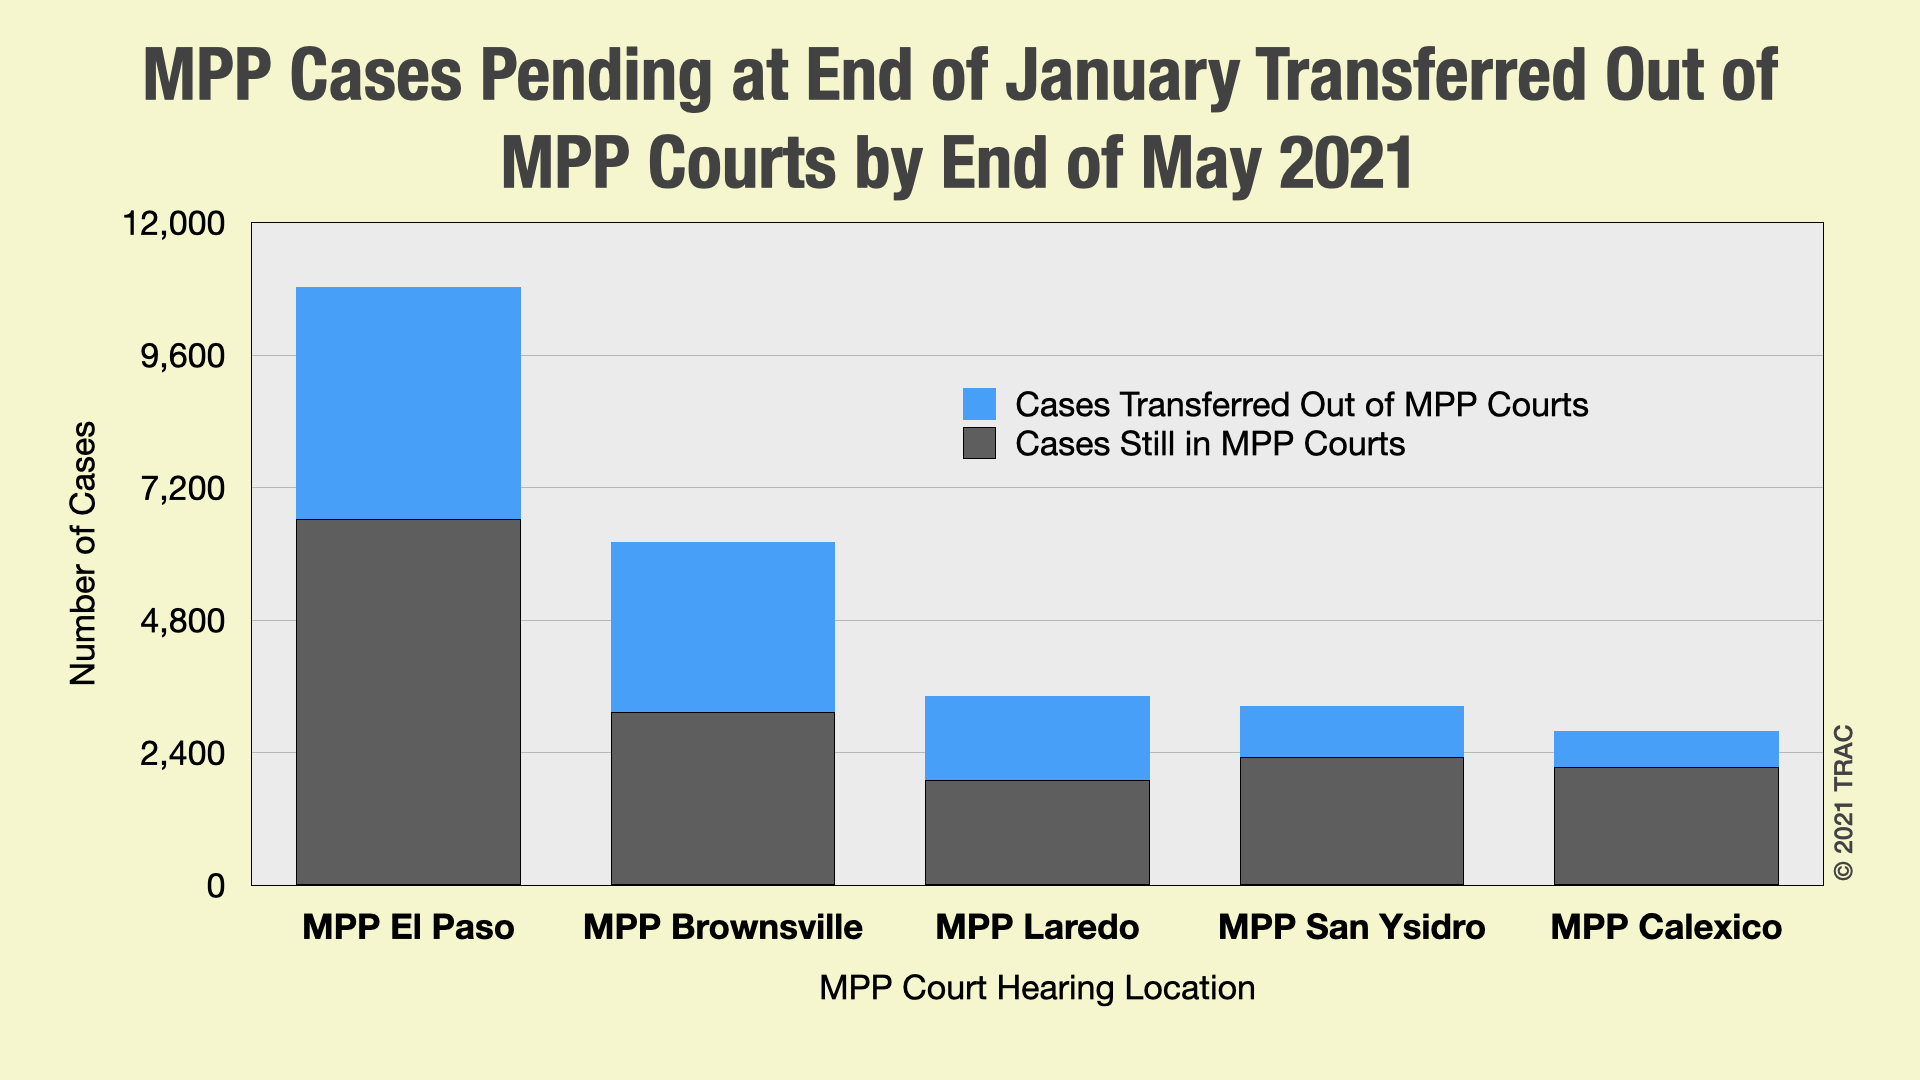
MPP cases assigned to the Brownsville, Texas hearing location continued to show the highest proportion of individuals allowed to enter the United States: 49.5 percent. However, MPP cases from Laredo, Texas which had been scheduled to start its processing over a month later made up a lot of lost ground by the end of May. A total of 44.7 percent of its pending MPP cases had been processed and individuals allowed into the U.S. — up from only 3 percent at the end of March, and 28 percent at the end of April. Laredo's rate by the end of May also surpassed the proportion at both the El Paso MPP court (38.8%) which also had been scheduled to start processing transfers more than a month earlier, as well as the San Ysidro MPP Court (28.2%) which had been scheduled to start processing cases the earliest. The Calexico MPP court remained in last place with less than a quarter (23.1%) of its pending caseload transferred. See Figure 1 and Table 1.
Comparing actual numbers of cases processed during May, records show that the El Paso MPP court processed the largest number — a total of 839 of its MPP cases were transferred to courts inside the U.S. This was followed by the MPP court at Laredo which processed 587 cases during May. The Brownsville MPP court only managed to process 298 cases. This was followed by the San Ysidro MPP court with 165 recorded transfers during May. The Calexico MPP court was in last place with just 99 of its cases recorded as transferred last month.
(Click for larger image)
| MPP Immigration Court Hearing Location End of January |
Pending Cases as of:* | Cases Transferred as of:** | Total Percent Transferred | ||
| End of January | End of March | End of April | End of May | ||
| MPP Court El Paso | 10,834 | 1,357 | 3,362 | 4,201 | 38.8% |
| MPP Brownsville Gateway International Bridge | 6,220 | 1,719 | 2,784 | 3,082 | 49.5% |
| MPP Laredo, Texas - Port of Entry | 3,434 | 102 | 948 | 1,535 | 44.7% |
| MPP Court San Ysidro Port | 3,239 | 467 | 748 | 913 | 28.2% |
| MPP Court Calexico Port | 2,786 | 266 | 545 | 644 | 23.1% |
| Total** | 26,513 | 3,911 | 8,387 | 10,375 | 39.1% |
Inequities Emerge in Transfers by Nationality
The percent of MPP cases paroled into the country varies significantly by nationality. Seven out of every ten individuals from Venezuela (71%) and nearly six out of every Cuban (58%) with pending MPP cases had been paroled into the U.S. by the end of May to await their Immigration Court hearings. In contrast, much lower percentages of people from Guatemala (21%), Peru (21%), Brazil (16%) and Ecuador (5%) with pending MPP cases had made their way into the U.S. by the same time. See Table 2.
These numbers reflect worrisome inequities in the pace and number of transfers by nationality. Since the Biden administration's implementation of this new MPP policy began back in February, current inequities the took place in May cannot be simply attributed to start-up delays. For example, while individuals from Guatemala had 4,493 pending MPP cases compared to just 1,672 pending MPP cases for individuals from Venezuela, there were three times the number of Venezuelans (325) allowed into the U.S. compared to just 110 Guatemalans during May. Perhaps even more startling, of the 2,557 individuals from Ecuador with pending MPP cases only 15 individuals were allowed into the U.S.
Other nationalities with pending MPP cases also had unusually small numbers of individuals processed. There were 1,354 MPP cases for individuals from Honduras and during May just 74 cases were processed. For Brazil, with 584 pending MPP cases at the end of January, just 22 cases were transferred to Immigration Courts inside the U.S. during May. Individuals from Peru saw only 4 of their 116 pending cases processed, and Colombians saw just 3 of their 114 pending MPP cases processed during May.
| Nationality | Pending MPP Cases | Transferred by End of May | ||
| Number | Percent | Number | Rate* | |
| Cuba | 7,596 | 28.6% | 4,423 | 58.2% |
| Honduras | 5,877 | 22.2% | 2,132 | 36.3% |
| Guatemala | 4,493 | 16.9% | 958 | 21.3% |
| Ecuador | 2,557 | 9.6% | 120 | 4.7% |
| El Salvador | 1,940 | 7.3% | 864 | 44.5% |
| Venezuela | 1,672 | 6.3% | 1,179 | 70.5% |
| Nicaragua | 1,354 | 5.1% | 454 | 33.5% |
| Brazil | 584 | 2.2% | 96 | 16.4% |
| Peru | 116 | 0.4% | 24 | 20.7% |
| Colombia | 114 | 0.4% | 34 | 29.8% |
| Other | 213 | 0.8% | 91 | 42.7% |
| Total | 26,516 | 100.0% | 10,375 | 39.1% |
Where Inside the U.S. Did MPP Cases Go?
More than 80 different hearing locations across the country received MPP transferred cases between February and May 2021. Florida proved to be the most popular location that the 10,375 MPP entrants transferred their cases to, followed by Texas. In fact, fully 31 percent of cases — nearly one in three — transferred to either Miami, Florida (2,195 cases) or Orlando, Florida (1,054 cases). The hearing location in Dallas, Texas received the third most transferred cases (578), following by Houston, Texas (S. Gessner) with 450. San Antonio, Texas was in fifth place with 414, followed by Houston (Greenspoint Park) with 403.
Other hearing locations in Georgia, California, Virginia, and New Jersey also were among the top ten. Table 6 provides a complete list of Immigration Court hearing locations where individuals transferred their cases.
| Immigration Court Hearing Location MPP Cases Transferred | Cases Transferred as of: | ||
| End of March | End of April | End of May | |
| All | 3,911 | 8,387 | 10,375 |
| Miami, Florida | 651 | 1,791 | 2,195 |
| Orlando, Florida | 321 | 808 | 1,054 |
| Dallas, Texas | 201 | 443 | 578 |
| Houston - S. Gessner | 144 | 335 | 450 |
| San Antonio, Texas | 135 | 324 | 414 |
| Houston Greenspoint Park | 117 | 316 | 403 |
| Atlanta, Georgia | 131 | 250 | 304 |
| Los Angeles, California | 139 | 248 | 279 |
| Arlington, Virginia | 143 | 229 | 251 |
| Newark, New Jersey | 134 | 228 | 280 |
| Charlotte | 115 | 216 | 288 |
| Baltimore, Maryland | 126 | 208 | 243 |
| Memphis, Tennessee | 137 | 207 | 273 |
| Chicago, Illinois | 101 | 199 | 245 |
| San Francisco, California | 114 | 197 | 234 |
| Louisville, Kentucky | 69 | 176 | 218 |
| Boston, Massachusetts | 86 | 170 | 200 |
| New Orleans, Louisiana | 89 | 165 | 193 |
| Las Vegas, Nevada | 66 | 161 | 183 |
| Houston, Texas | 83 | 155 | 178 |
| Denver, Colorado | 64 | 112 | 149 |
| Omaha, Nebraska | 51 | 111 | 143 |
| New York City, New York | 54 | 110 | 130 |
| El Paso, Texas | 19 | 107 | 140 |
| Van Nuys Immigration Court | 63 | 104 | 116 |
| Philadelphia, Pennsylvania | 58 | 99 | 114 |
| New York Varick | 58 | 98 | 119 |
| Salt Lake City, Utah | 28 | 88 | 105 |
| New York Broadway | 45 | 77 | 90 |
| Harlingen, Texas | 43 | 70 | 77 |
| Phoenix, Arizona | 24 | 66 | 79 |
| Kansas City, Missouri | 32 | 56 | 71 |
| Seattle, Washington | 30 | 53 | 57 |
| Hartford, Connecticut | 23 | 48 | 62 |
| Cleveland, Ohio | 20 | 47 | 59 |
| Los Angeles - North Los Angeles Street | 34 | 47 | 59 |
| Bloomington | 21 | 30 | 42 |
| Detroit, Michigan | 12 | 29 | 35 |
| Portland, Oregon | 8 | 27 | 41 |
| San Diego, California | 22 | 24 | 47 |
| Buffalo, New York | 8 | 22 | 20 |
| Leland Federal Building | 14 | 20 | 37 |
| San Antonio Satellite Office | 3 | 16 | 20 |
| Not Known | 10 | 14 | 15 |
| Portland, Oregon - POO | 15 | 13 | 0 |
| Tucson, Arizona | 5 | 11 | 12 |
| Port Isabel Service Processing Center | 7 | 9 | 9 |
| Sacramento Immigration Court | 7 | 8 | 9 |
| Arlington Detained Location | 0 | 5 | 0 |
| Honolulu, Hawaii | 4 | 4 | 4 |
| San Francisco Annex | 4 | 4 | 4 |
| MIA Non-Detained Juveniles | 0 | 4 | 11 |
| Pearsall, Texas - Detention Facility | 4 | 3 | 2 |
| San Francisco Non-Detained Juveniles | 2 | 2 | 3 |
| Eloy INS Detention Center | 1 | 2 | 0 |
| El Paso Juvenile Detained | 1 | 2 | 1 |
| Pittsburgh, Pennsylvania | 1 | 2 | 2 |
| Boise, Idaho | 0 | 2 | 4 |
| San Antonio Detained Juvenile | 0 | 2 | 0 |
| La Palma Correctional Center | 3 | 1 | 0 |
| Boston Detained | 2 | 1 | 1 |
| Conroe Immigration Court | 1 | 1 | 2 |
| Newark Detained DOCket | 1 | 1 | 1 |
| Pittsburgh Detained Juveniles | 1 | 1 | 1 |
| San Juan, Puerto Rico | 1 | 1 | 2 |
| Denver Family Unit | 0 | 1 | 3 |
| Imperial, California | 0 | 1 | 1 |
| The Villages, Inc. | 0 | 1 | 0 |
| Otero County Processing Center | 0 | 1 | 1 |
| San Antonio Non-Detained Juvenile | 0 | 1 | 2 |
| San Diego Non-Detained Juvenile | 0 | 1 | 1 |
| Southwest Key Sunzal | 0 | 1 | 0 |
| La Palma | 3 | 0 | 0 |
| Laredo, Texas - Detention Facility | 1 | 0 | 0 |
| Houston Female Detained | 1 | 0 | 0 |
| El Paso Service Processing Center | 0 | 0 | 2 |
| Pittsburgh Juvenile | 0 | 0 | 2 |
| La Palma Eloy | 0 | 0 | 1 |
| Imperial Detained | 0 | 0 | 1 |
| Phoenix Juvenile | 0 | 0 | 1 |
| La Palma Correctional Center | 0 | 0 | 1 |
| Winn Correctional Facility | 0 | 0 | 1 |
Footnotes
[1] These individuals joined 2,987 people with pending MPP cases who, due to special circumstances, were allowed to enter the country during the Trump administration to await their court hearings.
[2] "On June 1, 2021,...the Secretary of Homeland Security made a determination that MPP be terminated." That announcement was said to "not impact this phased strategy for the safe and orderly entry into the United States of certain individuals enrolled in MPP." And, of course, this announcement came after the results analyzed in this report with data on transfers through the end of May 2021.
[3] On June 14, 2021, Alberto Cabezas from UNHCR Mexico told TRAC that as of that date a total of 11,974 individuals had been screened for COVID and allowed to enter the United States.