Now Over 8,000 MPP Cases Transferred Into United States Under Biden
As of the end of April 2021, a total of 8,387 individuals formerly forced to remain in Mexico under the Migrant Protection Protocols (MPP) have been able to enter the United States since President Biden ended this Trump-era program[1]. TRAC previously reported that by the end of March 3,911 individuals had been allowed to enter the U.S. under a phased process. During April, the pace picked up so that by the end of last month entrants had increased to 8,387—more than double the previous total which had covered transfers during February and March. According to court records, as of the end of April a total of 18,087 individuals still remain in Mexico and have not yet been allowed to enter the U.S.
These findings come from analysis conducted by the Transactional Records Access Clearinghouse (TRAC) at Syracuse University. Results are based on comparing MPP court records at the end of January 2021 matched with those from the end of April 2021. TRAC analyzed this matched MPP case cohort to track the Biden administration's phased process of allowing individuals entry into the U.S.
Pace of Transfers Varied by Location
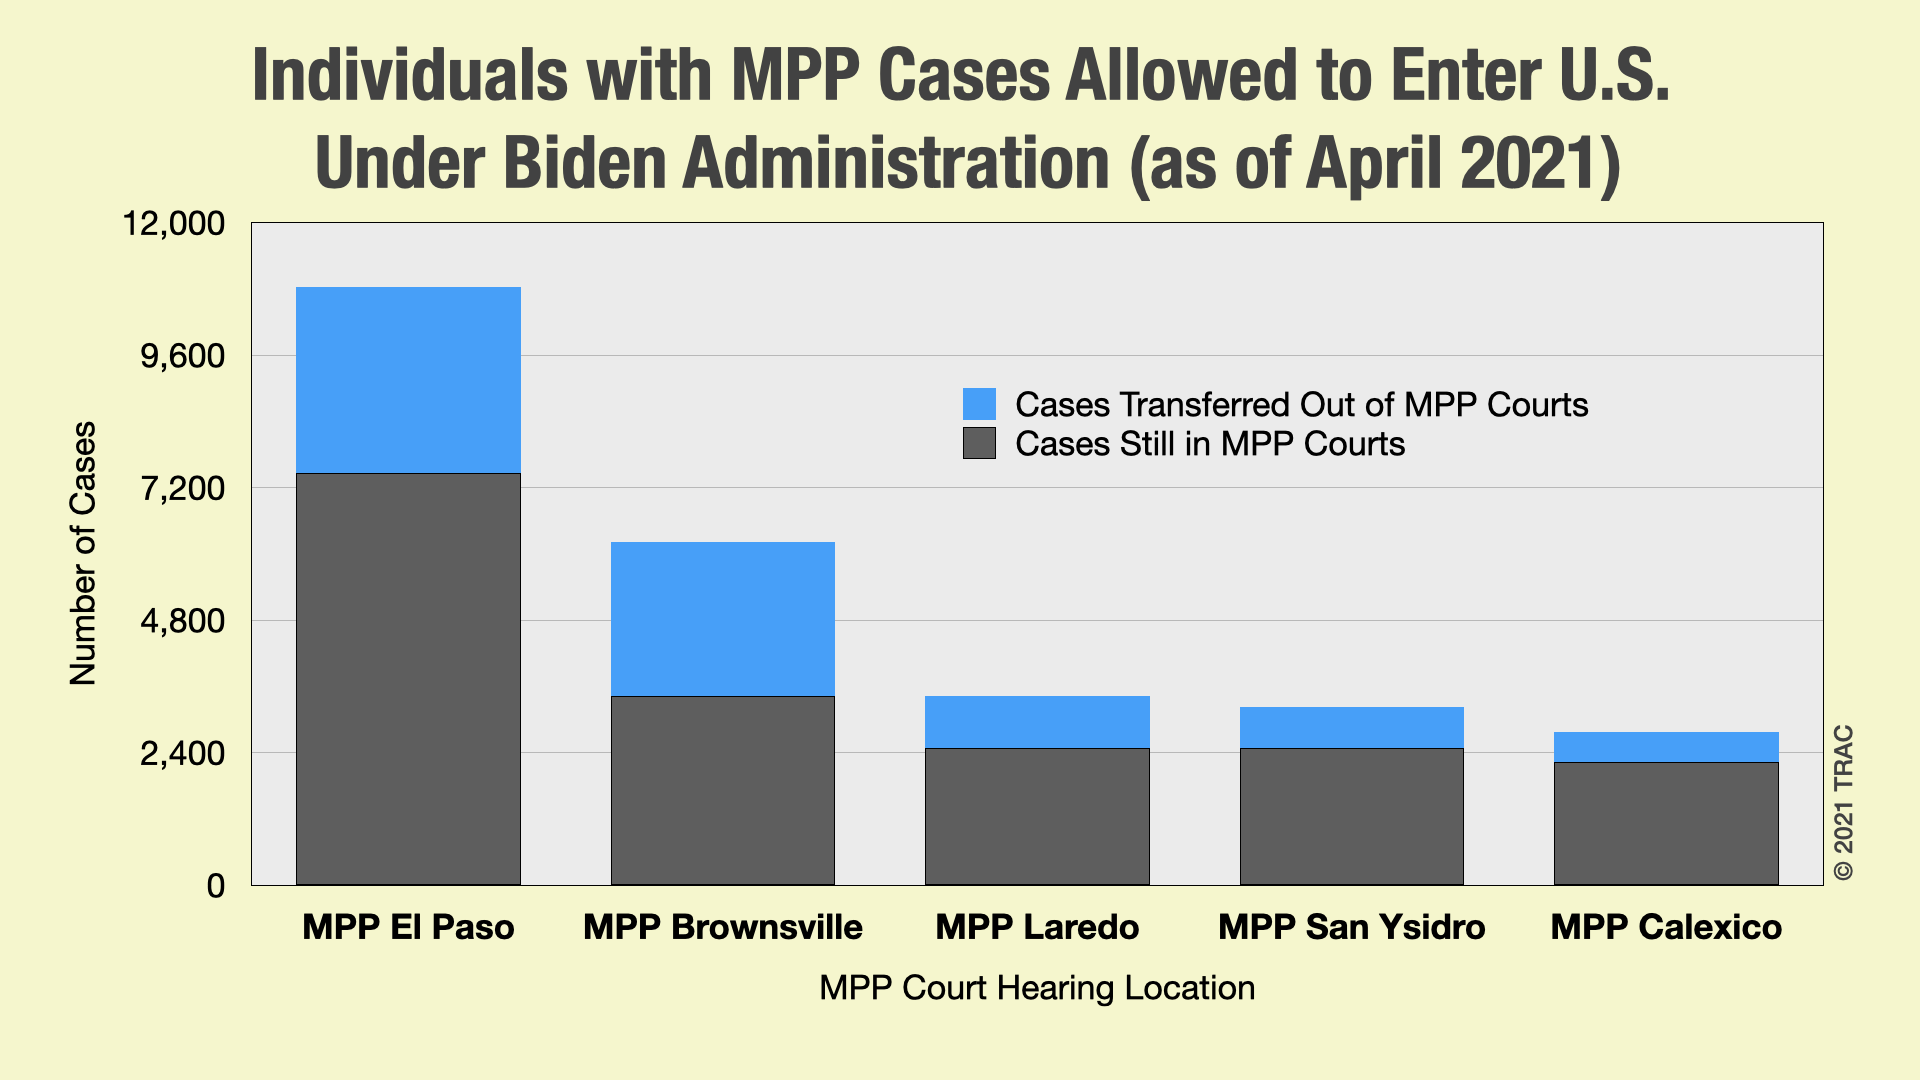
MPP cases assigned to the Brownsville, Texas hearing location continued to show the highest proportion of individuals allowed to enter the U.S.: 45 percent. However, MPP cases from Laredo, Texas which had been scheduled to start its processing over a month later made up a lot of lost ground by the end of April. Only 3 percent of its cases had been transferred into the U.S. at the end of March to await their Immigration Court hearings. But by the end of April this had jumped to 28 percent, vaulting ahead of rates in the San Ysidro MPP Court which had been scheduled to start processing cases the earliest. Laredo's rate was also close behind the proportion at the El Paso MPP court which also had been scheduled to start processing transfers more than a month earlier. See Figure 1 and Table 1.
(Click for larger image)
| MPP Immigration Court Hearing Location End of January |
Pending Cases as of:* | Cases Transferred as of:** | Total Percent Transferred | ||
| End of March | End of April | End of March | End of April | ||
| MPP Court El Paso | 10,825 | 10,830 | 1,357 | 3,362 | 31.0% |
| MPP Brownsville Gateway International Bridge | 6,207 | 6,211 | 1,719 | 2,784 | 44.8% |
| MPP Laredo, Texas - Port of Entry | 3,408 | 3,426 | 102 | 948 | 27.7% |
| MPP Court San Ysidro Port | 3,217 | 3,226 | 467 | 748 | 23.2% |
| MPP Court Calexico Port | 2,775 | 2,781 | 266 | 545 | 19.6% |
| Total** | 26,432 | 26,474 | 3,911 | 8,387 | **31.7% |
Not only were processing rates highest from the MPP courts in El Paso and Brownsville, but the sheer number of individuals transferred into the U.S. from these two MPP courts were the greatest. Transfers into the U.S. from the MPP courts in El Paso and Brownsville accounted for nearly three out of every four individuals (73%) allowed to enter the U.S. This was due in part to the much larger volume of MPP cases pending there.
Pace of Transfers Varied by How Long Cases Had Been Pending
MPP court locations also showed very different priorities assigned to cases that had been waiting the longest versus shortest periods of time. Laredo, Texas and San Ysidro, California MPP courts tended to follow a 'first in-first processed' pattern.
In contrast, for individuals in the MPP courts in El Paso, Texas and Calexico, California, cases tended to prioritize more recent arrivals. In El Paso, for example, only 15 percent of individuals who had been waiting since FY 2019 had been allowed into the U.S., as compared with 52 percent of those arriving at the border in FY 2020 and 66 percent allowed into the U.S. who had just arrived during FY 2021 (October 2020-January 2021). The Calexico MPP court showed a very similar pattern with 19 percent processed into U.S. for those waiting since FY 2019, 48 percent processed for FY 2020, and 67 percent processed for arrivals in FY 2021. See Table 2.
| MPP Immigration Court Hearing Location | MPP Cases Pending | Percent Allowed into U.S. by Date of NTA | ||
| End of January | FY 2019 | FY 2020 | FY 2021 | |
| MPP Court El Paso | 10,830 | 15% | 52% | 66% |
| MPP Brownsville Gateway International Bridge | 6,211 | 48% | 18% | 40% |
| MPP Laredo, Texas - Port of Entry | 3,426 | 58% | 21% | 29% |
| MPP Court San Ysidro Port | 3,226 | 38% | 11% | 10% |
| MPP Court Calexico Port | 2,781 | 19% | 48% | 67% |
| Total | 26,474 | 39% | 20% | 35% |
Pace of Transfers by Nationality
Around half of individuals from Venezuela (51%) and Cuba (46%) with pending MPP cases had been paroled into the U.S. to awaiting their Immigration Court hearings by the end of April. In contrast, much lower percentages of people from Guatemala (19%), Peru (17%), Brazil (13%) and Ecuador (4%) with pending MPP cases had made their way into the U.S. by the same time. See Figure 2.and Table 3.

(Click for larger image)
Part of this difference may be explained by the higher concentration of Venezuelans and Cubans assigned to MPP courts in Texas, where the speed of processing of transfers was much higher than in the California MPP courts. See Table 4. Individuals from Peru, Brazil and Ecuador experienced among the lowest transfer rates even though their cases were similarly concentrated in Texas MPP courts, indicating that court location did not provide a full explanation of the disparities.
Some of these differences can be explained by the timing of when different nationality groups arrived. The picture is somewhat complicated since, as we saw above, the impact of arrival times varied by MPP court in determining whether persons who waited longer periods of time were processed first or last. For example, two out of three (68%) Guatemalans had arrived at the southwest border during FY 2019. However, few individuals from Peru, Brazil or Ecuador had arrived in this early wave during FY 2019. And nearly half (45%) of Nicaraguans assigned to MPP arrived very recently (October 2020 - January 2021). This means that who is being allowed to enter the United States is conditioned by which point of entry they went to and when (during the life of MPP) they arrived. See Table 5 and compare with Tables 2-4.
| Nationality | Pending MPP Cases | Transferred by End of April | ||
| Number | Percent | Number | Rate* | |
| Cuba | 7,593 | 28.7% | 3,473 | 45.7% |
| Honduras | 5,864 | 22.2% | 1,792 | 30.6% |
| Guatemala | 4,483 | 16.9% | 848 | 18.9% |
| Ecuador | 2,557 | 9.7% | 105 | 4.1% |
| El Salvador | 1,935 | 7.3% | 732 | 37.8% |
| Venezuela | 1,663 | 6.3% | 854 | 51.4% |
| Nicaragua | 1,355 | 5.1% | 380 | 28.0% |
| Brazil | 584 | 2.2% | 74 | 12.7% |
| Peru | 116 | 0.4% | 20 | 17.2% |
| Colombia | 114 | 0.4% | 31 | 27.2% |
| Other | 210 | 0.8% | 78 | 37.1% |
| Total | 26,474 | 100.0% | 8,387 | 31.7% |
| Nationality | Pending MPP Cases | Percent in MPP Hearing Locations at: | |||||
| El Paso | Brownsville | Laredo | San Ysidro | Calexico | Total % | ||
| Cuba | 7,593 | 57% | 26% | 11% | 2% | 4% | 100% |
| Honduras | 5,864 | 24% | 25% | 17% | 23% | 12% | 100% |
| Guatemala | 4,483 | 29% | 13% | 3% | 21% | 34% | 100% |
| Ecuador | 2,557 | 73% | 15% | 8% | 2% | 3% | 100% |
| El Salvador | 1,935 | 24% | 36% | 10% | 25% | 5% | 100% |
| Venezuela | 1,663 | 27% | 24% | 40% | 6% | 2% | 100% |
| Nicaragua | 1,355 | 21% | 47% | 19% | 11% | 3% | 100% |
| Brazil | 584 | 97% | 0% | 0% | 2% | 1% | 100% |
| Peru | 116 | 36% | 36% | 15% | 12% | 1% | 100% |
| Colombia | 114 | 54% | 22% | 5% | 17% | 2% | 100% |
| Other | 210 | 33% | 31% | 30% | 3% | 4% | 100% |
| Total | 26,474 | 41% | 23% | 13% | 12% | 10% | 100% |
| Nationality | MPP Cases Pending | Percent Allowed into U.S. by Date of NTA | |||
| FY 2019 | FY 2020 | FY 2021 | Total NTAs | ||
| Cuba | 7,604 | 34% | 47% | 19% | 100% |
| Honduras | 5,874 | 58% | 41% | 0% | 100% |
| Guatemala | 4,484 | 68% | 32% | 1% | 100% |
| Ecuador | 2,558 | 5% | 74% | 21% | 100% |
| El Salvador | 1,938 | 55% | 45% | 0% | 100% |
| Venezuela | 1,663 | 26% | 56% | 18% | 100% |
| Nicaragua | 1,356 | 20% | 35% | 45% | 100% |
| Brazil | 585 | 0% | 67% | 33% | 100% |
| Peru | 116 | 9% | 53% | 38% | 100% |
| Colombia | 114 | 17% | 46% | 37% | 100% |
| Other | 182 | 9% | 46% | 37% | 100% |
| All Nationalities | 26,474 | 42% | 46% | 12% | 100% |
Asylum-Seekers Inside United States More Likely to Have an Attorney
Given the complexity of immigration law and the asylum process, immigration attorneys have been shown to play a central role in the process and outcome of asylum cases. TRAC previously found that asylum-seekers who obtain an attorney are five times more likely to be granted asylum. TRAC also found that very few asylum seekers in MPP were represented by an attorney.
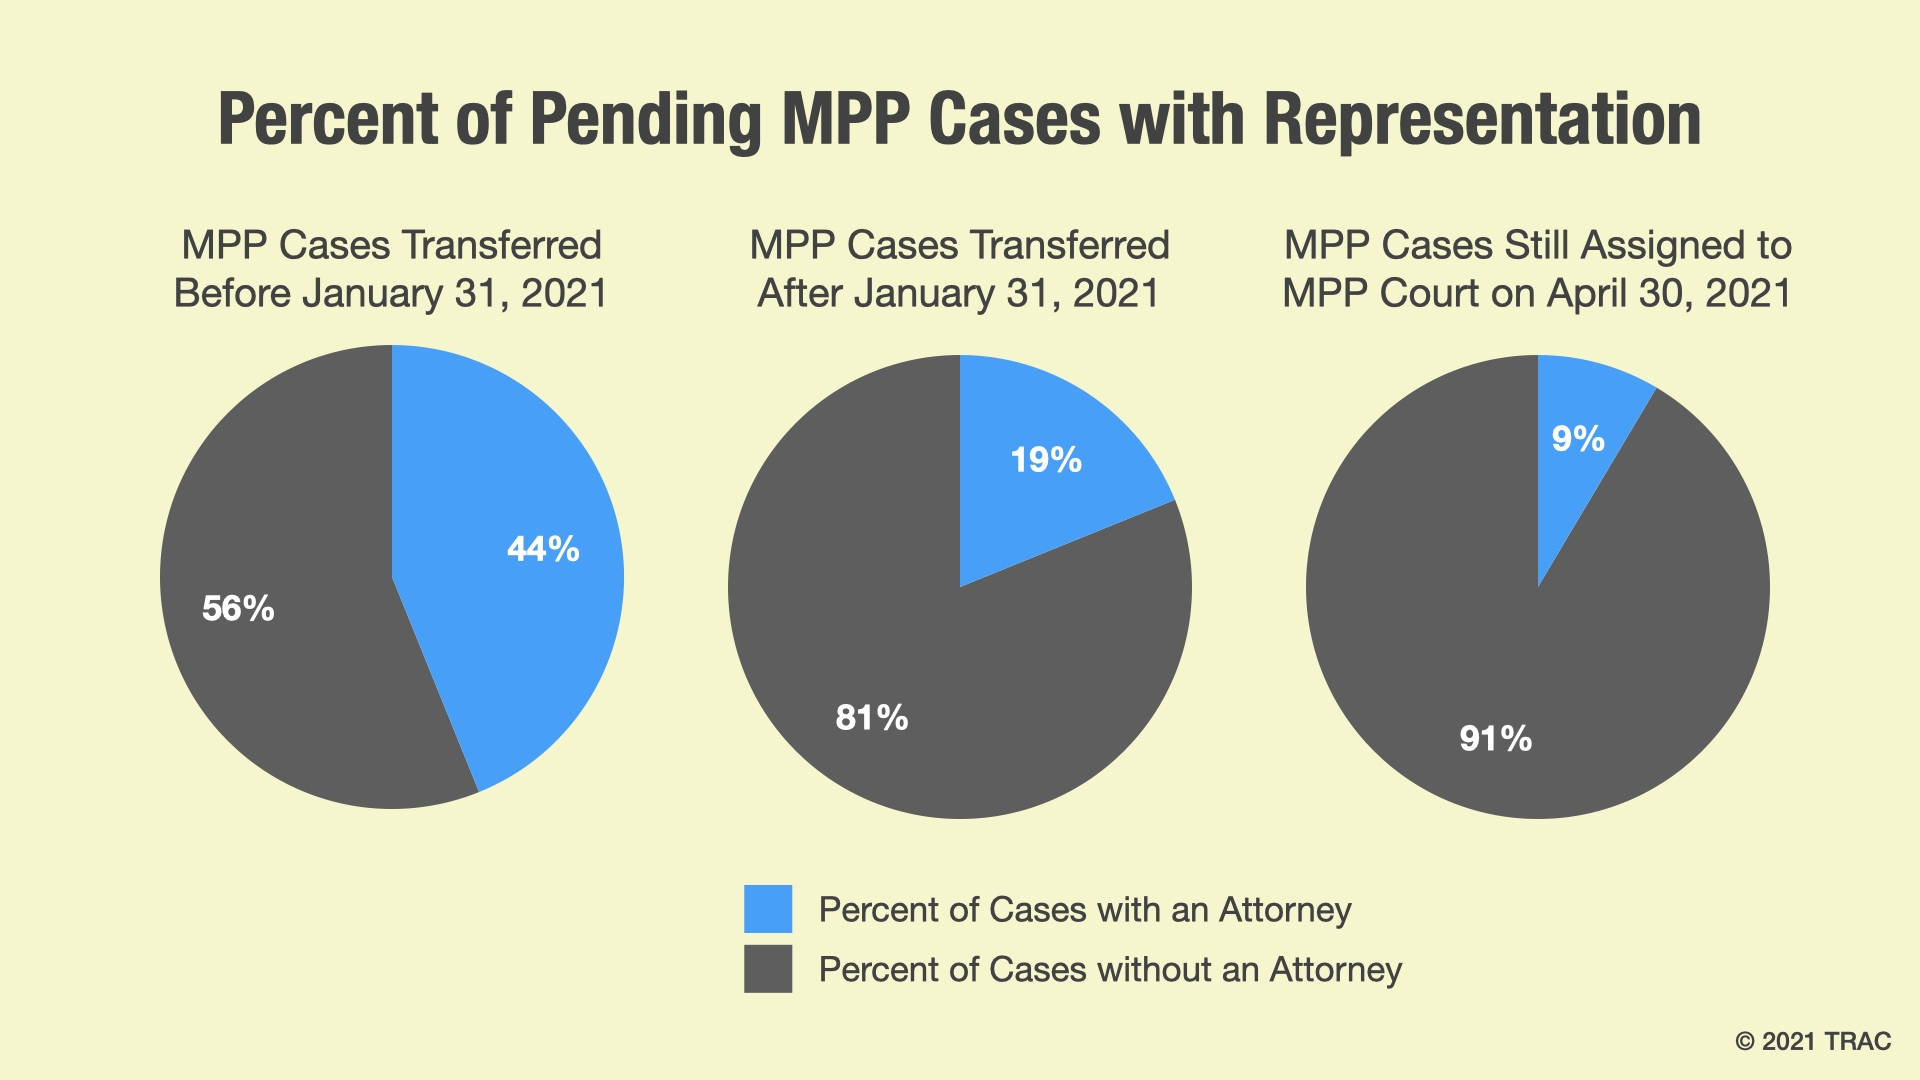
Updated data through the end of April 2021 shows that the likelihood of asylum seekers being represented by an attorney increases after the person is paroled into the United States and increases the longer the person is in the United States. For this section, we include cases that were transferred to a non-MPP court prior to January to illustrate how more time in the United States contributes to the likelihood of obtaining representation.
Of the nearly 3,000 individuals with pending cases in MPP who were paroled into the country on or before January 31 of this year, 44 percent of them now showed a record of an attorney on file. For cases paroled in February through April, this number was lower at 19 percent, but still higher than the 9 percent of those still in Mexico who had an attorney.
(Click for larger image)
Although representation rates among MPP cases have been low, having an attorney in itself may have made it more likely for migrants to be aware of and to complete the required MPP registration process through the UNHCR's Conecta website. Only individuals who registered were considered for transfer. Moreover, the percent of these cases with representation may increase over time, between now and the time their cases are heard and decided. For comparison, 80 percent of the asylum cases of the nearly 60,000 cases decided in FY 2020 were represented by an attorney (see also TRAC's asylum decisions tool here).
Where Inside the U.S. Did MPP Cases Go?
A total of 74 different hearing locations across the country received MPP transferred cases during February - April 2021. Florida proved to be the most popular location that the 8,387 MPP entrants transferred their cases to, followed by Texas. In fact, fully 31 percent of cases—nearly one in three—transferred to either Miami, Florida (1,791 cases) or Orlando, Florida (808 cases). The hearing location in Dallas, Texas received the third most transferred cases (443), following by Houston, Texas (S. Gessner) with 335. San Antonio, Texas was in fifth place with 324.
Other hearing locations in Georgia, California, Virginia, and New Jersey also were among the top ten. Table 6 provides a complete list of Immigration Court hearing locations where individuals transferred their cases.
| Immigration Court Hearing Location MPP Cases Transferred |
Cases Transferred as of: | |
| End of March | End of April | |
| All | 3,911 | 8,387 |
| Miami, Florida | 651 | 1,791 |
| Orlando, Florida | 321 | 808 |
| Dallas, Texas | 201 | 443 |
| Houston - S. Gessner | 144 | 335 |
| San Antonio, Texas | 135 | 324 |
| Houston Greenspoint Park | 117 | 316 |
| Atlanta, Georgia | 131 | 250 |
| Los Angeles, California | 139 | 248 |
| Arlington, Virginia | 143 | 229 |
| Newark, New Jersey | 134 | 228 |
| Charlotte | 115 | 216 |
| Baltimore, Maryland | 126 | 208 |
| Memphis, Tennessee | 137 | 207 |
| Chicago, Illinois | 101 | 199 |
| San Francisco, California | 114 | 197 |
| Louisville, Kentucky | 69 | 176 |
| Boston, Massachusetts | 86 | 170 |
| New Orleans, Louisiana | 89 | 165 |
| Las Vegas, Nevada | 66 | 161 |
| Houston, Texas | 83 | 155 |
| Denver, Colorado | 64 | 112 |
| Omaha, Nebraska | 51 | 111 |
| New York City, New York | 54 | 110 |
| El Paso, Texas | 19 | 107 |
| Van Nuys Immigration Court | 63 | 104 |
| Philadelphia, Pennsylvania | 58 | 99 |
| New York Varick | 58 | 98 |
| Salt Lake City, Utah | 28 | 88 |
| New York Broadway | 45 | 77 |
| Harlingen, Texas | 43 | 70 |
| Phoenix, Arizona | 24 | 66 |
| Kansas City, Missouri | 32 | 56 |
| Seattle, Washington | 30 | 53 |
| Hartford, Connecticut | 23 | 48 |
| Cleveland, Ohio | 20 | 47 |
| Los Angeles - North Los Angeles Street | 34 | 47 |
| Bloomington | 21 | 30 |
| Detroit, Michigan | 12 | 29 |
| Portland, Oregon | 8 | 27 |
| San Diego, California | 22 | 24 |
| Buffalo, New York | 8 | 22 |
| Leland Federal Building | 14 | 20 |
| San Antonio Satellite Office | 3 | 16 |
| Unnamed | 10 | 14 |
| Portland, Oregon - POO | 15 | 13 |
| Tucson, Arizona | 5 | 11 |
| Port Isabel Service Processing Center | 7 | 9 |
| Sacramento Immigration Court | 7 | 8 |
| Arlington Detained Location | 0 | 5 |
| Honolulu, Hawaii | 4 | 4 |
| San Francisco Annex | 4 | 4 |
| MIA Non-Detained Juveniles | 0 | 4 |
| Pearsall, Texas - Detention Facility | 4 | 3 |
| San Francisco Non-Detained Juveniles | 2 | 2 |
| Eloy INS Detention Center | 1 | 2 |
| El Paso Juvenile Detained | 1 | 2 |
| Pittsburgh, Pennsylvania | 1 | 2 |
| Boise, Idaho | 0 | 2 |
| San Antonio Detained Juvenile | 0 | 2 |
| La Palma Correctional Center | 3 | 1 |
| Boston Detained | 2 | 1 |
| Conroe Immigration Court | 1 | 1 |
| Newark Detained DOCket | 1 | 1 |
| Pittsburgh Detained Juveniles | 1 | 1 |
| San Juan, Puerto Rico | 1 | 1 |
| Denver Family Unit | 0 | 1 |
| Imperial, California | 0 | 1 |
| The Villages, Inc. | 0 | 1 |
| Otero County Processing Center | 0 | 1 |
| San Antonio Non-Detained Juvenile | 0 | 1 |
| San Diego Non-Detained Juvenile | 0 | 1 |
| Southwest Key Sunzal | 0 | 1 |
| La Palma | 3 | 0 |
| Laredo, Texas - Detention Facility | 1 | 0 |
| Houston Female Detained | 1 | 0 |
How TRAC Identified Cases for This Study
TRAC's MPP analysis identified cases that were initially assigned to one of the Immigration Courts designated as an MPP hearing location along the U.S.-Mexico border in the Executive Office for Immigration Review's (EOIR) internal court records[1]. Once a case has been filed at an MPP court, TRAC is able to follow the life of the case over time. For this report, TRAC analyzed MPP cases at the end of January, matched them with case-by-case court records at the end of April, and then identified cases that had been transferred to a non-MPP court. Due to anticipated delays between the time that an asylum seeker is paroled into the United States and the time that the court case is reassigned (i.e. transferred) to a court near that person's final destination, this approach may not necessarily capture all cases where parole has been granted.
Tables in this report focus upon MPP pending cases (29,462). This included all cases that had
been pending at the end of January (29,148), plus an additional 314 closed cases that had
reopened during the February - April 2021 period. Of these, 26,474 cases individuals were still
waiting outside the U.S. at the end of January when President Biden assumed office. A total of
2,988 MPP cases of the pending total of 29,462 had already transferred into the U.S. during
President Trump's administration[2].
Footnotes
[1]
EOIR also established a flag for MPP cases but this wasn't consistently used. As a cross-check, TRAC identified
MPP cases if a case was identified either by this flag or assignment to a MPP hearing location.
[2]
This report includes additional MPP cases closed at the end of March that were reopened during April. These
newly reopened cases were not included in TRAC's earlier report based on their status at the end of March.