Asylum Outcome Continues to Depend on the Judge Assigned
The outcome for asylum seekers continues to depend on the identity of the immigration judge assigned to hear the case. If you, for example, were one of the 6,922 asylum seekers whose cases were decided in the San Francisco Immigration Court over the last six years, the odds of denial varied from only 9.4 percent all the way up to 97.1 percent depending upon the judge you had. For the 1,233 individuals whose cases were heard by the Newark Immigration Court, the odds of denial ranged between 10.9 percent all the way up to 98.7 percent depending upon the judge you appeared before. Stated another way, the odds of being granted asylum could be as high as 90 percent or as low as 3 percent in these two courts depending upon which immigration judge you were assigned.
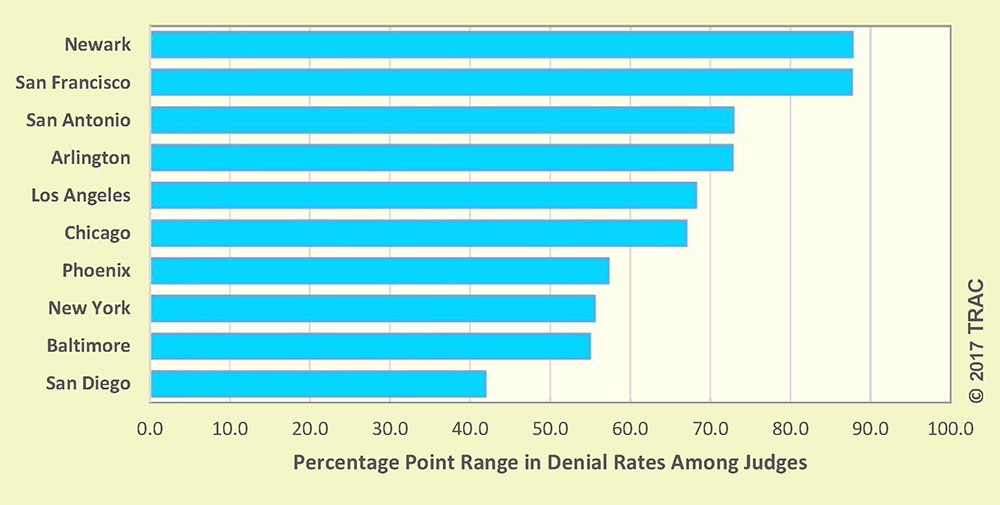
Figure 1. Range in Judge Asylum Denial Rates
(Click for larger image)
The two courts with largest number of asylum cases, New York and Los Angeles, also had sizable judge- to-judge differences in judge asylum decisions. Although disparities were not quite as extreme as in San Francisco and Newark, the New York Immigration Court judge denial rates ranged from a low of only 3.0 percent up to a high of 58.5 percent. Denial rates were generally higher in Los Angeles. However, they were equally varied. The disparity in asylum outcomes among the judges on the Los Angeles court ranged from a low of 29.4 percent denied to a high of 97.5 percent. The remainder of the Los Angeles judges ranged widely between these two extremes.
Figure 1 shows the ten courts with the largest judge-to-judge differences in their asylum decisions.

Figure 2. Change in Asylum Decision Disparity in Ten Immigration Courts
(Click for larger image)
TRAC's 2016 detailed analysis of asylum decision disparities noted that while judge-to-judge decision disparities have long existed, between 2010 and 2016 judge-to-judge decision disparities got worse. Increased disparities were found in 12 out of the 16 courts studied last year. This year's report shows that these sizable disparities remain. For both Newark and San Francisco, in fact, disparity levels had worsened, as had judge-to-judge differences for the Chicago Immigration Court. The Los Angeles and San Diego courts saw modest improvement. See Figure 2. Results for the complete list of courts are shown in Table 1. Most courts saw little meaningful change[1].
| Immigration Court | Asylum Decisions | Number of Judges* | Judge Denial Rate | Change from 2016 Report** | ||
| Lowest | Highest | Range | ||||
| New York | 36,310 | 35 | 3.0 | 58.5 | 55.5 | -1.3 |
| Los Angeles | 12,404 | 34 | 29.4 | 97.5 | 68.1 | -7.2 |
| San Francisco | 6,922 | 21 | 9.4 | 97.1 | 87.7 | 5.3 |
| Houston | 4,395 | 7 | 71.8 | 95.7 | 23.9 | -5.4 |
| Arlington | 3,722 | 8 | 16.5 | 89.2 | 72.7 | 1.6 |
| Baltimore | 3,459 | 6 | 6.5 | 61.4 | 54.9 | -0.7 |
| Orlando | 3,282 | 6 | 64.3 | 78.8 | 14.5 | -4.2 |
| Miami | 3,257 | 13 | 52.6 | 85.7 | 33.1 | -0.4 |
| Seattle | 3,152 | 5 | 52.9 | 70.5 | 17.6 | 0.2 |
| Boston | 2,207 | 7 | 21.8 | 55.8 | 34.0 | -3.5 |
| Chicago | 2,100 | 8 | 28.7 | 95.6 | 66.9 | 12.1 |
| Atlanta | 2,029 | 5 | 79.1 | 97.8 | 18.7 | -8.2 |
| Miami - Krome | 1,817 | 5 | 90.8 | 96.6 | 5.8 | -1.5 |
| Memphis | 1,806 | 4 | 55.9 | 83.5 | 27.6 | -4.4 |
| San Antonio | 1,762 | 7 | 24.9 | 97.7 | 72.8 | 0.1 |
| Dallas | 1,735 | 5 | 69.8 | 93.8 | 24.0 | 0.1 |
| San Diego | 1,649 | 7 | 46.2 | 88.1 | 41.9 | -13.2 |
| Adelanto | 1,544 | 6 | 80.9 | 90.4 | 9.5 | -7.1 |
| Los Fresnos | 1,519 | 4 | 74.2 | 98.2 | 24.0 | 20.5 |
| Tacoma | 1,497 | 4 | 71.8 | 84.0 | 12.2 | 10.3 |
| Charlotte | 1,295 | 3 | 75.4 | 85.7 | 10.3 | -2.6 |
| Cleveland | 1,277 | 3 | 65.5 | 91.1 | 25.6 | -1.8 |
| Elizabeth | 1,234 | 4 | 43.4 | 70.2 | 26.8 | -0.6 |
| Newark | 1,233 | 6 | 10.9 | 98.7 | 87.8 | 4.9 |
| Philadelphia | 1,228 | 5 | 24.2 | 61.4 | 37.2 | 9.1 |
| Las Vegas | 1,165 | 4 | 86.5 | 97.3 | 10.8 | 5.6 |
| Portland | 1,117 | 2 | 47.0 | 55.4 | 8.4 | -0.5 |
| Bloomington | 1,097 | 3 | 71.1 | 97.2 | 26.1 | 0.7 |
| Detroit | 1,088 | 5 | 74.4 | 81.5 | 7.1 | -3.6 |
| Hartford | 1,004 | 2 | 40.9 | 71.6 | 30.7 | 2.8 |
| Honolulu | 992 | 2 | 21.4 | 27.7 | 6.3 | -3.8 |
| El Paso | 953 | 5 | 94.6 | 98.8 | 4.2 | -1.5 |
| Omaha | 862 | 3 | 62.3 | 87.7 | 25.4 | 7.6 |
| Eloy | 843 | 5 | 89.5 | 99.2 | 9.7 | 2.7 |
| Lumpkin | 828 | 3 | 95.8 | 97.7 | 1.9 | 1.4 |
| Denver | 791 | 4 | 35.4 | 62.4 | 27.0 | -1.6 |
| York | 784 | 4 | 74.1 | 90.0 | 15.9 | 1.1 |
| Pearsall | 732 | 5 | 71.5 | 85.3 | 13.8 | 8.2 |
| Houston - Detained | 600 | 3 | 86.3 | 97.0 | 10.7 | -2.2 |
| Kansas City | 572 | 3 | 63.7 | 71.3 | 7.6 | 1.6 |
| Oakdale | 568 | 3 | 87.7 | 100.0 | 12.3 | 5.4 |
| Tucson | 456 | 2 | 60.5 | 73.4 | 12.9 | 2.7 |
| Batavia | 428 | 2 | 81.3 | 82.7 | 1.4 | (new court) |
| Florence | 366 | 2 | 92.1 | 94.2 | 2.1 | 0.5 |
| Harlingen | 363 | 2 | 47.5 | 64.5 | 17.0 | 6.0 |
| New Orleans | 330 | 2 | 54.2 | 70.4 | 16.2 | 0.0 |
| Phoenix | 281 | 2 | 8.8 | 66.0 | 57.2 | 7.9 |
| Aurora | 233 | 2 | 77.6 | 83.3 | 5.7 | -13.0 |
| West Valley | 212 | 1 | 75.0 | 75.0 | (only 1 judge) | |
| Imperial | 208 | 1 | 86.5 | 86.5 | (only 1 judge) | |
| Buffalo | 141 | 1 | 70.9 | 70.9 | (only 1 judge) | |
| New York - DET | 122 | 1 | 69.7 | 69.7 | (only 1 judge) | |
| Hagatna | 106 | 1 | 50.0 | 50.0 | (only 1 judge) | |
Measuring Asylum Decision Disparity
Of course, in general it is natural for asylum decisions to vary since the merits of individual cases differ. Achieving the goal of "equal justice" under the law does not mean assuring the same outcome for every case. Decisions should reflect the individual merits of each situation, applying the standards that the law sets. Some individuals merit asylum, while others do not. And a host of factors can affect the outcome, including whether the individual is represented as well as the circumstances in the country the asylum seeker was from.
|
Eleven years ago, in July 2006, TRAC published its first report on the handling of asylum cases by the Immigration Courts. After examining all recorded cases in which immigration judges decided asylum cases from FY 1994 through the first few months of fiscal year 2005, TRAC found wide disparities in asylum denial rates had persisted from judge-to-judge throughout this period. In August 2006, shortly after TRAC's report was published, then U.S. Attorney General Alberto Gonzales directed EOIR "to review [TRAC's] study and provide an analysis and, if appropriate, recommendations to the Deputy AG with respect to this issue." This specific directive was part of wider reform measures the Attorney General also announced. EOIR's internal review confirmed that a problem did exist. Steps were taken through enhanced training, mentoring, and supervision to try to address the problem. TRAC's evaluation published in 2009 on the impact of these reforms found that decision disparities in asylum decisions had in fact decreased somewhat following these reforms. Unfortunately, these improvements did not persist. TRAC's evaluation in 2016 indicated asylum decision disparity had risen markedly once more. During the intervening period the court has become increasingly challenged by a rising backlog of cases, and the focus of the administration had shifted to expediting proceedings to better cope with this rising workload. |
Grant and denial rates are observed to vary markedly by the nationality of the asylum seeker[2]. However, regardless of nationality, if an asylum seeker is not represented by an attorney, almost all (91%) are denied.
As the composition of cases and the ability of asylum seekers to obtain representation varies from one court to another, one cannot meaningfully compare asylum decisions between judges sitting on different courts. Even if we control for representation status, we cannot tell to what degree the differences observed are because the composition - and hence the potential "worthiness" - of cases heard by each judge account for the differences in Judge A versus Judge B's denial rates.
When we compare the decisions of judges sitting on the same bench, however, the situation is different. To the extent incoming asylum cases within a court are assigned to judges on a random basis, the make- up of cases assigned to Judges A and B are roughly equivalent. These random assignment procedures parallel what happens in a scientific experiment where individuals are assigned randomly to different treatments, as in a drug trial. Here, however, instead of being assigned to different drug treatments, asylum seekers are assigned to different judges. When individual judges handle a sufficient number of asylum requests, random case assignment will result in each judge being assigned a roughly equivalent mix of "worthy" cases.
Judge
Reports
Under these circumstances any large differences in the denial rates of individual judges are unlikely to be the result of differences in the nature of the incoming cases. Instead, they are likely to reflect the personal perspective that each judge brings to the bench. These differences are what TRAC means when it uses the term, decision disparity.
Table 2 lists the record of 293 Immigration Court judges -- sorted from highest to lowest asylum denial rates -- within the court each served on during the FY 2012 - FY 2017 period. More detailed information about each judge and his or her asylum decisions can be found in TRAC's latest individual judge-by-judge reports.
(click title to open in a new window)
| Denial Rate | ||||
|---|---|---|---|---|
| Immigration Court | Judge | Decisions | % Grants | % Denials |
| Denial Rate | ||||
| Immigration Court | Judge | Decisions | % Grants | % Denials |
| Adelanto | Everett, Timothy R. | 322 | 9.6 | 90.4 |
| Lee, Amy T. | 492 | 9.6 | 90.4 | |
| McGrail, Elizabeth H. | 281 | 11.0 | 89.0 | |
| Left, James M. | 172 | 11.0 | 89.0 | |
| Dorfman, Arlene E. | 136 | 14.7 | 85.3 | |
| Burke, David H. | 141 | 19.1 | 80.9 | |
| Arlington | Harris, Rodger C. | 371 | 10.8 | 89.2 |
| Bain, Quynh Vu | 193 | 57.5 | 42.5 | |
| Owens, Robert P. | 300 | 64.3 | 35.7 | |
| Snow, Thomas G. | 964 | 68.4 | 31.6 | |
| Iskra, Wayne R. | 350 | 75.4 | 24.6 | |
| Burman, Lawrence O. | 747 | 76.7 | 23.3 | |
| Bryant, John Milo | 397 | 82.9 | 17.1 | |
| Schmidt, Paul W. | 400 | 83.5 | 16.5 | |
| Atlanta | Wilson, Earle B. | 1114 | 2.2 | 97.8 |
| Cassidy, William A. | 220 | 4.1 | 95.9 | |
| Pelletier, Jonathan D. | 408 | 11.8 | 88.2 | |
| Garcia, Madeline | 148 | 12.2 | 87.8 | |
| Houser, Wayne K., Jr. | 139 | 20.9 | 79.1 | |
| Aurora | McGrail, Elizabeth H. | 108 | 16.7 | 83.3 |
| Livingston, Donn L. | 125 | 22.4 | 77.6 | |
| Baltimore | Kessler, Elizabeth A. | 511 | 38.6 | 61.4 |
| Williams, Phillip T. | 947 | 43.5 | 56.5 | |
| Dornell, Lisa | 562 | 56.2 | 43.8 | |
| Gossart, John F., Jr. | 221 | 57.9 | 42.1 | |
| Crosland, David W. | 894 | 58.6 | 41.4 | |
| Slavin, Denise N. | 324 | 93.5 | 6.5 | |
| Batavia | Connelly, Steven J. | 225 | 17.3 | 82.7 |
| Reid, John B. | 203 | 18.7 | 81.3 | |
| Bloomington | Nickerson, William J., Jr. | 218 | 2.8 | 97.2 |
| Olmanson, Kristin W. | 346 | 26.6 | 73.4 | |
| Conley de Castro, Susan E. | 533 | 28.9 | 71.1 | |
| Boston | Harris, Rodger C. | 129 | 44.2 | 55.8 |
| O'Malley, Brenda M. | 467 | 58.7 | 41.3 | |
| D'Angelo, Matthew J. | 440 | 65.5 | 34.5 | |
| Feder, Robin E. | 400 | 65.7 | 34.3 | |
| Gagnon, Paul M. | 260 | 66.2 | 33.8 | |
| Shapiro, Leonard I. | 213 | 67.6 | 32.4 | |
| O'Sullivan, Maureen S. | 298 | 78.2 | 21.8 | |
| Buffalo | Montante, Philip J., Jr | 141 | 29.1 | 70.9 |
| Charlotte | Couch, V. Stuart | 414 | 14.3 | 85.7 |
| Pettinato, Barry J. | 597 | 17.4 | 82.6 | |
| Holmes-Simmons, Theresa | 284 | 24.6 | 75.4 | |
| Chicago | DiMarzio, Philip L. | 180 | 4.4 | 95.6 |
| Zerbe, Craig M. | 218 | 45.0 | 55.0 | |
| Vinikoor, Robert D. | 495 | 46.5 | 53.5 | |
| Giambastiani, Jennie L. | 344 | 50.9 | 49.1 | |
| Perez-Guzman, Virginia | 323 | 57.0 | 43.0 | |
| McNulty, Sheila | 189 | 59.3 | 40.7 | |
| Cuevas, Carlos | 236 | 64.0 | 36.0 | |
| Deangelis, Kathryn L. | 115 | 71.3 | 28.7 | |
| Cleveland | Evans, D. William, Jr. | 418 | 8.9 | 91.1 |
| Janas, Thomas | 337 | 16.9 | 83.1 | |
| Brown, Alison M. | 522 | 34.5 | 65.5 | |
| Dallas | Sims, Deitrich H. | 289 | 6.2 | 93.8 |
| Ozmun, Richard R. | 418 | 16.5 | 83.5 | |
| Kimball, R. Wayne | 616 | 17.0 | 83.0 | |
| Weiss, Daniel H. | 197 | 22.8 | 77.2 | |
| Baird, Michael P. | 215 | 30.2 | 69.8 | |
| Denver | Tsankov, Mimi | 149 | 37.6 | 62.4 |
| Livingston, Donn L. | 241 | 48.1 | 51.9 | |
| Cordova, David J. | 124 | 49.2 | 50.8 | |
| Trujillo, Eileen R. | 277 | 64.6 | 35.4 | |
| Detroit | Newberry, Robert D. | 254 | 18.5 | 81.5 |
| Jebson, Mark J. | 118 | 18.6 | 81.4 | |
| Nettles, Marsha K. | 147 | 19.7 | 80.3 | |
| Gorland, Jennifer M. | 198 | 19.7 | 80.3 | |
| Paruch, David H. | 371 | 25.6 | 74.4 | |
| El Paso | Mahtabfar, Sunita B. | 171 | 1.2 | 98.8 |
| Gonzalez, Guadalupe R. | 112 | 2.7 | 97.3 | |
| Roepke, Thomas C. | 139 | 2.9 | 97.1 | |
| Ruhle, Stephen M. | 200 | 4.5 | 95.5 | |
| Abbott, William L. | 331 | 5.4 | 94.6 | |
| Elizabeth | Tadal, Mirlande | 530 | 29.8 | 70.2 |
| Finston, Leo A. | 161 | 48.4 | 51.6 | |
| Morris, Daniel A. | 202 | 50.5 | 49.5 | |
| Harbeck, Dorothy A. | 341 | 56.6 | 43.4 | |
| Eloy | DeVitto, James Alan | 119 | 0.8 | 99.2 |
| Davis, John W. | 133 | 3.8 | 96.2 | |
| Feldman, Irene C. | 194 | 6.2 | 93.8 | |
| Spencer-Walters, Linda Inez | 235 | 9.8 | 90.2 | |
| Phelps, Richard A. | 162 | 10.5 | 89.5 | |
| Florence | Arellano, Silvia R. | 137 | 5.8 | 94.2 |
| Taylor, Bruce A. | 229 | 7.9 | 92.1 | |
| Hagatna | Beamer, Dayna M. | 106 | 50.0 | 50.0 |
| Harlingen | Ayala, David | 245 | 35.5 | 64.5 |
| Tovar, Eleazar | 118 | 52.5 | 47.5 | |
| Hartford | Straus, Michael W. | 647 | 28.4 | 71.6 |
| Verrillo, Philip | 357 | 59.1 | 40.9 | |
| Honolulu | Wagner, Clarence M., Jr. | 282 | 72.3 | 27.7 |
| Beamer, Dayna M. | 710 | 78.6 | 21.4 | |
| Houston | Harris, Monique | 835 | 4.3 | 95.7 |
| Picos, Georgina M. | 160 | 6.9 | 93.1 | |
| Endelman, Gary E. | 1333 | 13.1 | 86.9 | |
| Bhagat, Nimmo | 1186 | 14.0 | 86.0 | |
| Walton, Richard D. | 217 | 14.7 | 85.3 | |
| Brisack, Chris A. | 384 | 16.4 | 83.6 | |
| Rankin Yates, Clarease Rankin | 280 | 28.2 | 71.8 | |
| Houston - Detained | Luis, Lisa | 135 | 3.0 | 97.0 |
| Walton, Richard D. | 224 | 7.1 | 92.9 | |
| Greenstein, Saul | 241 | 13.7 | 86.3 | |
| Imperial | Staton, Jack W. | 208 | 13.5 | 86.5 |
| Kansas City | Baker, Glen R. | 143 | 28.7 | 71.3 |
| O'Malley, John R. | 192 | 30.7 | 69.3 | |
| Davis, Paula V. | 237 | 36.3 | 63.7 | |
| Las Vegas | Sharda, Munish | 263 | 2.7 | 97.3 |
| Romig, Jeffrey L. | 551 | 8.3 | 91.7 | |
| Alberdi, Yon K. | 218 | 10.1 | 89.9 | |
| Daugherty, Daniel J. | 133 | 13.5 | 86.5 | |
| Los Angeles | Munoz, Lorraine J. | 715 | 2.5 | 97.5 |
| Walsh, John F. | 245 | 2.9 | 97.1 | |
| Anderson, David C. | 162 | 4.3 | 95.7 | |
| Ruane, Rachel A. | 249 | 7.6 | 92.4 | |
| Riley, Kevin W. | 752 | 8.0 | 92.0 | |
| Maury, Carlos E. | 166 | 10.2 | 89.8 | |
| Naselow-Nahas, Tara | 1252 | 10.5 | 89.5 | |
| Ho, Anna | 205 | 13.2 | 86.8 | |
| O'Connor, Lee A. | 467 | 20.3 | 79.7 | |
| Tabaddor, Afsaneh Ashley | 547 | 21.4 | 78.6 | |
| Aina, Nathan N. | 102 | 23.5 | 76.5 | |
| Peters, Rose C. | 258 | 26.7 | 73.3 | |
| Rooyani, Rodin | 321 | 29.9 | 70.1 | |
| Bither, Christine A. | 201 | 30.3 | 69.7 | |
| Latimore, Jan D. | 331 | 32.3 | 67.7 | |
| Giattina, Anthony T. | 167 | 33.5 | 66.5 | |
| Travieso, Frank M. | 324 | 35.2 | 64.8 | |
| Burke, David H. | 237 | 35.9 | 64.1 | |
| Parchert, Brett M. | 458 | 36.7 | 63.3 | |
| Sitgraves, Darcy D. | 457 | 39.8 | 60.2 | |
| Bank, Ira E. | 436 | 43.6 | 56.4 | |
| Laurent, Scott D. | 146 | 43.8 | 56.2 | |
| Stancill, Christine E. | 679 | 44.2 | 55.8 | |
| Little, Monica M. | 443 | 44.5 | 55.5 | |
| Dorfman, Arlene E. | 347 | 44.7 | 55.3 | |
| Hong, J. Traci | 107 | 44.9 | 55.1 | |
| Dunkel-Bradley, Dorothy A. | 249 | 45.0 | 55.0 | |
| Costa, Philip J. | 409 | 49.1 | 50.9 | |
| Bass, Lori R. | 272 | 49.3 | 50.7 | |
| Coughlon, Robert E. | 161 | 56.5 | 43.5 | |
| O'Sullivan, Maureen S. | 393 | 61.1 | 38.9 | |
| Vahid-Tehrani, Gita | 416 | 64.9 | 35.1 | |
| Bakke Varzandeh, Joyce A. | 318 | 65.4 | 34.6 | |
| Neumeister, David | 412 | 70.6 | 29.4 | |
| Los Fresnos | Crews, John G. | 112 | 1.8 | 98.2 |
| Hunsucker, Keith E. | 555 | 18.9 | 81.1 | |
| Powell, Robert L. | 619 | 21.2 | 78.8 | |
| Achtsam, Howard E. | 233 | 25.8 | 74.2 | |
| Lumpkin | Duncan, Randall | 129 | 2.3 | 97.7 |
| Arrington, Saundra H. | 318 | 4.1 | 95.9 | |
| Trimble, Dan | 381 | 4.2 | 95.8 | |
| Memphis | Kaufman, Matthew W. | 328 | 16.5 | 83.5 |
| Holt, Rebecca L. | 719 | 35.0 | 65.0 | |
| Averwater, Richard J. | 190 | 42.6 | 57.4 | |
| Pazar, Charles E. | 569 | 44.1 | 55.9 | |
| Miami | Chapa, Teofilo | 287 | 14.3 | 85.7 |
| Videla, Gabriel C. | 119 | 14.3 | 85.7 | |
| Lopez-Enriquez, Maria M. | 304 | 21.1 | 78.9 | |
| Martinez-Esquivel, Lourdes | 343 | 25.9 | 74.1 | |
| Alexander, Scott G. | 212 | 27.4 | 72.6 | |
| Marks Lane, Denise A. | 307 | 29.6 | 70.4 | |
| Sanders, Charles J. | 169 | 29.6 | 70.4 | |
| Dowell, J. Daniel | 225 | 32.4 | 67.6 | |
| Balasquide, Javier E. | 187 | 32.6 | 67.4 | |
| Torreh-Bayouth, Lilliana | 432 | 34.3 | 65.7 | |
| Mart, Herbert Kevin | 279 | 34.4 | 65.6 | |
| Mander, Stephen E. | 260 | 46.9 | 53.1 | |
| Rodriguez de Jongh, Lourdes A. | 133 | 47.4 | 52.6 | |
| Miami - Krome | Ford, Rex J. | 590 | 3.4 | 96.6 |
| Opaciuch, John | 383 | 5.0 | 95.0 | |
| Opaciuch, Adam | 416 | 8.4 | 91.6 | |
| Chait, Barry S. | 155 | 9.0 | 91.0 | |
| Alexander, Scott G. | 273 | 9.2 | 90.8 | |
| New Orleans | Larocca, Joseph | 199 | 29.6 | 70.4 |
| Stogner, William Wayne | 131 | 45.8 | 54.2 | |
| New York | Hom, Sandy K. | 1033 | 41.5 | 58.5 |
| Vomacka, Alan A. | 823 | 43.9 | 56.1 | |
| Videla, Gabriel C. | 151 | 47.0 | 53.0 | |
| Nelson, Barbara A. | 1086 | 49.4 | 50.6 | |
| Christensen, Jesse B. | 1528 | 63.6 | 36.4 | |
| Poczter, Aviva L. | 1645 | 64.6 | 35.4 | |
| Cheng, Mary M. | 768 | 71.0 | 29.0 | |
| Loprest, F. James, Jr. | 1323 | 75.9 | 24.1 | |
| Tsankov, Mimi | 126 | 78.6 | 21.4 | |
| Kolbe, Margaret | 266 | 78.9 | 21.1 | |
| Balasquide, Javier E. | 1061 | 79.8 | 20.2 | |
| Wright, Virna A. | 1004 | 80.9 | 19.1 | |
| Van Wyke, William Van | 705 | 81.1 | 18.9 | |
| Segal, Alice | 1184 | 82.3 | 17.7 | |
| Rohan, Patricia A. | 1290 | 84.4 | 15.6 | |
| Zagzoug, Randa | 1057 | 84.6 | 15.4 | |
| Douchy, Evalyn P. | 265 | 84.9 | 15.1 | |
| Weisel, Robert D. | 434 | 85.7 | 14.3 | |
| Burr, Sarah M. | 192 | 87.5 | 12.5 | |
| Sichel, Helen J. | 1558 | 88.0 | 12.0 | |
| Morace, Philip L. | 1755 | 88.5 | 11.5 | |
| Laforest, Brigitte | 1854 | 90.2 | 9.8 | |
| Cassin, Olivia L. | 388 | 90.5 | 9.5 | |
| Chew, George T. | 1612 | 91.1 | 8.9 | |
| Schoppert, Douglas B. | 1421 | 91.1 | 8.9 | |
| Mulligan, Thomas J. | 665 | 91.4 | 8.6 | |
| Gordon-Uruakpa, Vivienne E. | 1353 | 91.5 | 8.5 | |
| McManus, Margaret | 1792 | 93.1 | 6.9 | |
| Cohen, Raisa | 243 | 93.4 | 6.6 | |
| Lamb, Elizabeth A. | 1627 | 94.7 | 5.3 | |
| Bain, Terry A. | 1776 | 94.9 | 5.1 | |
| Brennan, Noel A. | 2182 | 95.3 | 4.7 | |
| Khan, Amiena | 153 | 96.1 | 3.9 | |
| Bukszpan, Joanna M. | 1144 | 96.2 | 3.8 | |
| Leeds, Frederic G. | 846 | 97.0 | 3.0 | |
| New York - DET | Mulligan, Thomas J. | 122 | 30.3 | 69.7 |
| Newark | Reichenberg, Margaret R. | 149 | 1.3 | 98.7 |
| Finston, Leo A. | 165 | 29.7 | 70.3 | |
| Garcy, Annie S. | 269 | 63.9 | 36.1 | |
| Riefkohl, Alberto J. | 346 | 80.1 | 19.9 | |
| Khan, Amiena | 167 | 86.8 | 13.2 | |
| Leeds, Frederic G. | 137 | 89.1 | 10.9 | |
| Oakdale | Reese, Agnelis L. | 198 | 0.0 | 100 |
| Beatmann, Jerry A., Sr. | 142 | 6.3 | 93.7 | |
| Duck, John A., Jr. | 228 | 12.3 | 87.7 | |
| Omaha | Morris, Daniel A. | 310 | 12.3 | 87.7 |
| Anderson, Jack L. | 430 | 18.8 | 81.2 | |
| Fujimoto, James R. | 122 | 37.7 | 62.3 | |
| Orlando | Grim, James | 836 | 21.2 | 78.8 |
| Chapman, Kevin J. | 626 | 30.0 | 70.0 | |
| Karden, Stuart F. | 464 | 31.5 | 68.5 | |
| Ortiz-Segura, Rafael B. | 572 | 32.5 | 67.5 | |
| Lippman, Daniel | 364 | 35.2 | 64.8 | |
| Ghartey, Victoria L. | 420 | 35.7 | 64.3 | |
| Pearsall | McKee, Robert R. | 109 | 14.7 | 85.3 |
| Harlow, Craig A. | 174 | 14.9 | 85.1 | |
| Crossan, Thomas G., Jr. | 196 | 20.4 | 79.6 | |
| Santander, Daniel J. | 130 | 22.3 | 77.7 | |
| Freeman, D'anna H. | 123 | 28.5 | 71.5 | |
| Philadelphia | Carle, John B. | 101 | 38.6 | 61.4 |
| Morley, Steven A. | 368 | 53.8 | 46.2 | |
| Mills, Miriam K. | 196 | 66.8 | 33.2 | |
| Malloy, Rosalind K. | 270 | 69.3 | 30.7 | |
| Honeyman, Charles M. | 293 | 75.8 | 24.2 | |
| Phoenix | Freerks, LaMonte S. | 100 | 34.0 | 66.0 |
| Richardson, John W. | 181 | 91.2 | 8.8 | |
| Portland | Sloan, Andrea H. | 570 | 44.6 | 55.4 |
| Bennett, Michael H. | 547 | 53.0 | 47.0 | |
| San Antonio | Miles, Vernon Benet | 177 | 2.3 | 97.7 |
| Burkholder, Gary D. | 471 | 3.6 | 96.4 | |
| Crossan, Thomas G., Jr. | 342 | 17.0 | 83.0 | |
| McPhaul, Glenn P. | 153 | 35.9 | 64.1 | |
| Martinez, Anibal D. | 264 | 40.2 | 59.8 | |
| Zuniga, Bertha A. | 178 | 55.1 | 44.9 | |
| Burkhart, Margaret D. | 177 | 75.1 | 24.9 | |
| San Diego | Clemente, Jesus | 294 | 11.9 | 88.1 |
| McSeveney, Robert | 274 | 14.2 | 85.8 | |
| Law, Philip S. | 141 | 31.2 | 68.8 | |
| DePaolo, Zsa Zsa | 227 | 36.1 | 63.9 | |
| Ipema, Henry P., Jr. | 267 | 48.7 | 51.3 | |
| Renner, Renee L. | 290 | 50.0 | 50.0 | |
| Fernandez, Ignacio P. | 156 | 53.8 | 46.2 | |
| San Francisco | Murry, Anthony S. | 514 | 2.9 | 97.1 |
| Yamaguchi, Michael J. | 169 | 5.3 | 94.7 | |
| Tue, Phan-Quang | 160 | 47.5 | 52.5 | |
| Yeargin, Robert | 193 | 48.7 | 51.3 | |
| Teeter, Marilyn J. | 175 | 57.7 | 42.3 | |
| Geisse, Loreto S. | 714 | 68.1 | 31.9 | |
| Maggard, Robert P. | 151 | 68.9 | 31.1 | |
| Daw, Alison E. | 328 | 72.6 | 27.4 | |
| Webber, Polly A. | 508 | 73.4 | 26.6 | |
| Griswold, Stephen S. | 517 | 73.9 | 26.1 | |
| King, Carol A. | 475 | 74.7 | 25.3 | |
| Lyons, Joren | 507 | 75.3 | 24.7 | |
| Greene, Charles S., III. | 296 | 79.4 | 20.6 | |
| Hoogasian, Amy C. | 284 | 79.6 | 20.4 | |
| Paulino, Robin K. | 148 | 83.1 | 16.9 | |
| Hayward, Miriam R. | 233 | 84.1 | 15.9 | |
| Young, Elizabeth L. | 138 | 84.1 | 15.9 | |
| Savage, Patrick S. | 174 | 86.8 | 13.2 | |
| Marks, Dana Leigh | 533 | 87.2 | 12.8 | |
| Ramirez, Laura L. | 534 | 89.3 | 10.7 | |
| Jamil, Rebecca | 171 | 90.6 | 9.4 | |
| Seattle | Parchert, Brett M. | 920 | 29.5 | 70.5 |
| Walsh, John F. | 452 | 34.1 | 65.9 | |
| Kandler, Edward R. | 253 | 38.7 | 61.3 | |
| Josephson, Kenneth | 809 | 39.9 | 60.1 | |
| Defonzo, Paul A. | 718 | 47.1 | 52.9 | |
| Tacoma | Zanfardino, Richard | 131 | 16.0 | 84.0 |
| Odell, John C. | 420 | 25.2 | 74.8 | |
| Scala, Theresa M. | 499 | 25.5 | 74.5 | |
| Fitting, Tammy L. | 447 | 28.2 | 71.8 | |
| Tucson | Keenan, Sean H. | 233 | 26.6 | 73.4 |
| O'Leary, Thomas Michael | 223 | 39.5 | 60.5 | |
| West Valley | Anderson, David C. | 212 | 25.0 | 75.0 |
| York | Arthur, Andrew R. | 160 | 10.0 | 90.0 |
| Ellington, John P. | 156 | 12.2 | 87.8 | |
| Bain, Quynh Vu | 159 | 18.2 | 81.8 | |
| Durling, Walter A. | 309 | 25.9 | 74.1 | |
Footnotes
[1] TRAC combined six years of data to increase the number of judges that made at least 100 asylum decisions. That number was needed to help ensure that differences weren't simply due to random fluctuations. This year's report examined FY 2012 - FY 2017 while last year's report was based on asylum decisions during FY 2011 - FY 2016. Since five out of six years that went into the comparison remained the same, large differences in the findings between these two reports would not be expected.
[2] See, for example, the 2016 TRAC report on the impact of nationality on asylum outcome. Among the ten nationalities that had the largest number of Immigration Court asylum cases decided during FY 2011 - FY 2016, Mexico had the highest denial rate with nine out of ten (89.6%) turned down. While asylum seekers from Ethiopia and Eritrea were the most successful among the top ten nationalities with denial rates of only 16.5 percent and 17.5 percent, respectively.