Despite Hiring, Immigration Court Backlog and Wait Times Climb
The Immigration Court backlog keeps rising. As of the end of April 2017, the number of cases waiting for a decision had reached an all-time high of 585,930. See Figure 1. On average individuals have currently been waiting 670 days, and may have to wait much longer before their cases will be heard. Nine courts that currently account for a quarter of this backlog require some individuals to wait for more than four additional years from now before a hearing is scheduled. The Immigration Court in San Francisco with nearly 42,000 backlogged cases has some individuals waiting for more than five additional years—as much as 1,908 days longer—for their July 21, 2022 hearing date.
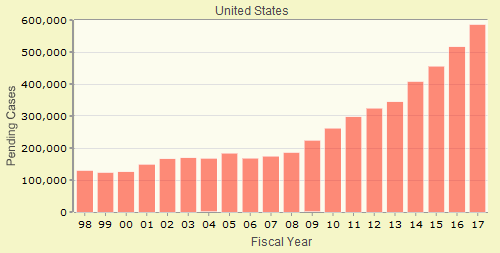
Figure 1. Immigration Court Backlog by Month
Viewing these figures from a different perspective, the existing large backlog and extraordinary wait times mean that some individuals are not scheduled to have their day in court until after President Trump's current four-year term in office has ended. And we are only a little more than 100 days into his four-year term.
These findings are based upon the very latest case-by-case court records—current through the end of April—that were obtained under the Freedom of information Act and analyzed by the Transactional Records Access Clearinghouse (TRAC) at Syracuse University.
New Judges Insufficient to Address Incoming Caseload
During the past 18 months, the court has been adding new judges. In contrast to 2013 and 2014 when few judges were added to court ranks, a total of 79 new immigration judges have been sworn in since November of 2015. See Figure 2. Funding for a modest additional 10 judges also has just been approved by Congress.
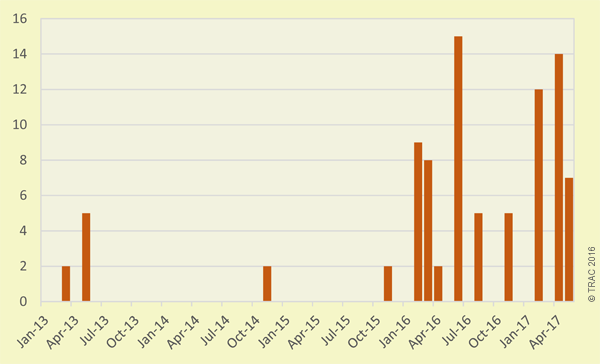
Figure 2. New Immigration Judge Appointments by Month
But there is little evidence that this increase in hiring is sufficient to handle the incoming caseload, let alone make a dent in the court 's mountainous backlog. Before this hiring spurt began, the backlog at the end of August 2015 stood at 456,644 cases. Then the average number of days individuals had been waiting was already at 635 days, with hearings for some scheduled as far as 1,766 additional days in the future. See earlier TRAC report.
Today the situation is significantly worse. As noted above, by the end of April 2017 the backlog had increased by 28.3 percent to 585,930. Individuals with pending cases already have waited an average of 670 days, up from 635 days. And for some their hearings are now scheduled as many as 1,908 days into the future, up from 1,766 days before this hiring spurt began.
Variation by Case Stage and Court Location
According to court records, over two-thirds (69%) of scheduled hearings are what the court calls "master calendar hearings." As EOIR explains, an individual's first appearance before an immigration judge in a removal proceeding is at a master calendar hearing. At that point, many individuals are then scheduled to appear at a later session to hear the merits of their cases. The purpose of the master calendar hearing is to advise the individuals of their rights, explain the removal charges the government has filed against them, take pleadings, identify and attempt to narrow the factual and legal issues, and set deadlines for filing any papers needed for subsequent hearings.
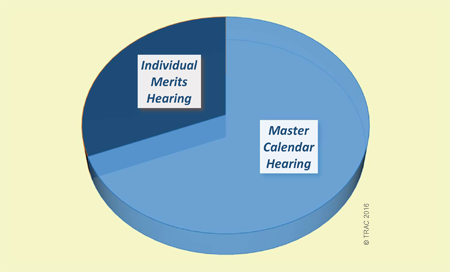
Figure 3. Type of Hearing Scheduled
Thus, except for individuals who want to immediately agree to their removal, the "master calendar hearing" is only the first hearing - not the last. The average additional time before a master calendar hearing was scheduled was nine months into the future. After the master calendar hearing, an individual merits hearing will then need to be scheduled. With the current backlog and already overcrowded dockets, the ultimate delay for individuals requiring merit hearings will as a result be a great deal longer than reflected in these data.
How quickly a case can be heard varies by court location, and the priority assigned to the case. Thus, there is tremendous variation in scheduled wait times from an average of 22 days for the Immigration Court hearing cases in the Cibola County Correctional Center in Minnesota, to 1,820 average days for individuals heard by the Immigration Court sitting in Chicago, Illinois.
Individuals detained by ICE are generally given priority and their cases are heard more quickly. In a directive issued January 31, 2017, the court limited priority assignments to: (1) detained individuals, (2) unaccompanied children in government care who do not have an identified sponsor, and (3) individuals released on bond as a result of the Rodriguez class action ruling now under review in the U.S. Supreme Court.
Information about the wait times for Immigration Court hearing locations with at least 25 pending cases at the end of April 2017 can be found in Table 1 below. Included in the table are the number of pending cases along with the average number of days these cases have already waited - the traditional backlog and wait times. Next to these columns is the average number of additional days that cases are waiting for a hearing before an immigration judge, based on when the hearing for each pending case is scheduled. In the next column is the total projected wait time - the average days "already waited" plus the average of "more until hearing" has been scheduled according to the court's current calendar.
Of course, hearings can be rescheduled sooner or moved later, so these statistics are merely projected figures for the average wait time based on the court's hearing schedule as of the end of April. In addition, it does not include any estimate of potential future delays that are likely to occur for individual merit hearings after the initial master calendar hearing that is now scheduled occurs.
(Click on column header to sort)
| State | Hearing Location | Pending Cases | Average Days | Latest Hearing Date Scheduled* |
|||
|---|---|---|---|---|---|---|---|
| Pending Cases |
Hearing Not Yet Scheduled |
Already Waited | More Until Hearing* | Projected Total Wait* | |||
| CA | San Francisco, California | 41,979 | 876 | 730 | 383 | 1,113 | 2022-07-21 |
| VA | Arlington, Virginia | 28,272 | 2,621 | 712 | 453 | 1,165 | 2021-12-30 |
| KY | Louisville, Kentucky | 3,330 | 53 | 643 | 362 | 1,005 | 2021-12-21 |
| MD | Baltimore, Maryland | 20,728 | 1,249 | 485 | 348 | 833 | 2021-12-16 |
| GA | Atlanta, Georgia | 16,282 | 5,600 | 668 | 880 | 1,548 | 2021-09-22 |
| CA | Imperial, California | 4,049 | 187 | 685 | 890 | 1,575 | 2021-09-10 |
| IL | Chicago, Illinois | 18,090 | 493 | 1,214 | 606 | 1,820 | 2021-06-30 |
| MA | Boston, Massachusetts | 14,316 | 681 | 707 | 358 | 1,065 | 2021-06-28 |
| OH | Cleveland, Ohio | 6,338 | 415 | 875 | 540 | 1,415 | 2021-05-26 |
| MI | Detroit, Michigan | 2,791 | 79 | 976 | 542 | 1,518 | 2021-04-22 |
| WA | Seattle, Washington | 8,070 | 318 | 596 | 400 | 996 | 2021-04-13 |
| IL | Chicago Non-Detained Juveniles | 5,884 | 134 | 382 | 298 | 680 | 2021-01-26 |
| NE | Omaha Juvenile | 1,507 | 57 | 388 | 288 | 676 | 2020-08-19 |
| NE | Omaha, Nebraska | 6,613 | 145 | 845 | 310 | 1,155 | 2020-05-13 |
| TX | Dallas, Texas | 10,222 | 1,216 | 557 | 409 | 966 | 2020-05-6 |
| TX | Southwest Key | 1,474 | 216 | 264 | 276 | 540 | 2020-02-27 |
| CA | Los Angeles, California | 54,386 | 1,863 | 718 | 195 | 913 | 2020-02-10 |
| OR | Portland - Adults and Children | 1,990 | 10 | 406 | 339 | 745 | 2020-01-30 |
| OR | Portland, Oregon | 1,827 | 169 | 726 | 373 | 1,099 | 2020-01-29 |
| VA | Arlington Juvenile | 5,270 | 410 | 375 | 228 | 603 | 2020-01-27 |
| CA | San Francisco Non-Detained Juveniles | 783 | 2 | 94 | 368 | 462 | 2020-01-24 |
| NJ | Newark, New Jersey | 24,151 | 629 | 937 | 290 | 1,227 | 2020-01-9 |
| TX | Houston, Texas | 46,305 | 1,908 | 846 | 586 | 1,432 | 2019-12-19 |
| KY | Louisville Juvenile | 477 | 9 | 340 | 317 | 657 | 2019-12-9 |
| TX | San Antonio, Texas | 25,841 | 959 | 939 | 842 | 1,781 | 2019-11-29 |
| MN | Bloomington | 5,014 | 139 | 660 | 332 | 992 | 2019-11-29 |
| MO | Kansas City, Missouri | 6,116 | 189 | 526 | 268 | 794 | 2019-11-29 |
| FL | Orlando, Florida | 8,994 | 345 | 367 | 264 | 631 | 2019-11-29 |
| AZ | Phoenix, Arizona | 7,085 | 683 | 860 | 254 | 1,114 | 2019-11-14 |
| NY | New York City, New York | 77,387 | 5,158 | 629 | 257 | 886 | 2019-11-13 |
| LA | New Orleans, Louisiana | 7,385 | 108 | 468 | 147 | 615 | 2019-10-18 |
| CO | Denver, Colorado | 10,455 | 127 | 1,048 | 177 | 1,225 | 2019-10-1 |
| TN | Memphis, Tennessee | 8,244 | 390 | 380 | 248 | 628 | 2019-07-31 |
| MN | Bloomington Juvenile | 293 | 7 | 147 | 110 | 257 | 2019-06-3 |
| ID | Boise, Idaho | 616 | 24 | 594 | 232 | 826 | 2019-05-13 |
| CT | Hartford, Connecticut | 2,483 | 97 | 414 | 202 | 616 | 2019-04-15 |
| OH | Ohio Dept. of Corr., Correctional Reception Center - ORI | 35 | 3 | 568 | 174 | 742 | 2019-03-14 |
| TX | El Paso, Texas | 5,037 | 136 | 815 | 249 | 1,064 | 2019-03-4 |
| PA | Philadelphia, Pennsylvania | 5,130 | 336 | 625 | 163 | 788 | 2019-02-13 |
| NJ | Newark Surge | 4,817 | 14 | 399 | 223 | 622 | 2019-01-31 |
| UT | Salt Lake City, Utah | 1,962 | 116 | 570 | 189 | 759 | 2019-01-24 |
| MA | Boston Unaccompanied Juvenile | 3,088 | 33 | 507 | 177 | 684 | 2018-12-20 |
| GA | Atlanta Detained Location | 516 | 63 | 77 | 94 | 171 | 2018-12-6 |
| TN | Memphis Juvenile | 1,216 | 12 | 241 | 156 | 397 | 2018-12-5 |
| FL | Miami, Florida | 28,499 | 1,244 | 566 | 123 | 689 | 2018-11-16 |
| CT | Hartford Juvenile | 569 | 1 | 368 | 120 | 488 | 2018-10-24 |
| HI | Honolulu, Hawaii | 512 | 6 | 258 | 220 | 478 | 2018-10-3 |
| NV | Las Vegas, Nevada | 2,002 | 216 | 695 | 197 | 892 | 2018-09-26 |
| NC | Charlotte | 5,927 | 126 | 323 | 130 | 453 | 2018-09-26 |
| NV | Las Vegas Juvenile | 1,107 | 20 | 256 | 120 | 376 | 2018-08-29 |
| MI | Detroit Juvenile | 1,063 | 5 | 262 | 112 | 374 | 2018-07-25 |
| TX | Harlingen, Texas | 2,627 | 194 | 666 | 122 | 788 | 2018-05-31 |
| PA | Pittsburgh, Pennsylvania | 511 | 6 | 477 | 95 | 572 | 2018-05-22 |
| NV | Reno, Nevada | 411 | 11 | 349 | 149 | 498 | 2018-05-17 |
| AK | Anchorage, Alaska | 61 | 25 | 521 | 226 | 747 | 2018-05-15 |
| NC | Charlotte Juvenile | 1,814 | 6 | 433 | 117 | 550 | 2018-04-4 |
| AZ | Eloy INS Detention Center | 1,163 | 72 | 227 | 80 | 307 | 2018-03-15 |
| IL | Illinois DOC- Statesville | 169 | 4 | 276 | 165 | 441 | 2018-03-12 |
| AZ | Phoenix Juvenile | 209 | 1 | 101 | 74 | 175 | 2018-03-9 |
| PA | Philadelphia Juvenile | 1,364 | 51 | 378 | 110 | 488 | 2018-02-21 |
| CT | Connecticut Dept. of Correction | 45 | 5 | 180 | 84 | 264 | 2018-02-8 |
| PA | Philadelphia Adults With Children | 1,540 | 15 | 322 | 120 | 442 | 2018-02-5 |
| CA | San Diego, California | 4,370 | 159 | 356 | 93 | 449 | 2018-01-26 |
| TX | Leland Federal Building | 1,394 | (90) | 832 | 64 | 896 | 2018-01-22 |
| MN | Minnesota Correctional Facility | 76 | 7 | 604 | 200 | 804 | 2018-01-19 |
| AZ | Florence, Arizona | 717 | 24 | 142 | 72 | 214 | 2018-01-10 |
| NJ | Essex County Jail | 430 | 14 | 100 | 26 | 126 | 2017-12-27 |
| AZ | Tucson, Arizona | 546 | 10 | 651 | 69 | 720 | 2017-12-19 |
| AZ | Arizona State Prison-Rynning Unit | 25 | - | 655 | 152 | 807 | 2017-12-12 |
| NY | Buffalo, New York | 1,215 | 73 | 689 | 93 | 782 | 2017-12-4 |
| NJ | Elizabeth Detention Center | 187 | 18 | 84 | 45 | 129 | 2017-12-4 |
| VI | St. Thomas, Virgin Islands | 33 | 1 | 183 | 138 | 321 | 2017-11-8 |
| CA | San Diego Juvenile | 268 | 14 | 135 | 52 | 187 | 2017-10-27 |
| FL | South Florida Reception Center | 28 | 2 | 117 | 65 | 182 | 2017-10-3 |
| PR | San Juan, Puerto Rico | 52 | 5 | 211 | 53 | 264 | 2017-09-28 |
| TX | San Antonio Non-Detained Juvenile | 731 | (3) | 247 | 63 | 310 | 2017-09-26 |
| GA | Georgia Department of Corrections- Diagnostic | 222 | - | 224 | 74 | 298 | 2017-09-25 |
| TX | Pearsall, Texas - Detention Facility | 1,112 | 243 | 56 | 48 | 104 | 2017-09-21 |
| AZ | Arizona DOC- Perryville | 31 | 1 | 393 | 68 | 461 | 2017-09-14 |
| NY | Downstate Correctional Facility | 139 | 3 | 279 | 36 | 315 | 2017-09-11 |
| CA | Los Angeles 3 | 279 | 33 | 128 | 47 | 175 | 2017-09-11 |
| AZ | Arizona DOC- Tucson | 143 | 1 | 369 | 45 | 414 | 2017-09-7 |
| TX | El Paso Service Processing Center | 447 | 63 | 148 | 35 | 183 | 2017-09-6 |
| TX | Harlingen, Texas | 466 | 11 | 87 | 49 | 136 | 2017-09-6 |
| NY | Batavia Service Processing Center | 350 | 24 | 98 | 37 | 135 | 2017-09-6 |
| MT | Helena, Montana | 32 | 5 | 358 | 52 | 410 | 2017-09-1 |
| MD | Baltimore, Maryland Juvenile | 162 | 42 | 123 | 115 | 238 | 2017-08-24 |
| CA | Imperial Detained | 457 | 68 | 93 | 41 | 134 | 2017-08-24 |
| CA | Otay Mesa Detention Center | 707 | 28 | 147 | 32 | 179 | 2017-08-23 |
| NY | New York Service Processing Center (Varick St) | 638 | 79 | 114 | 37 | 151 | 2017-08-18 |
| NY | Buffalo Juvenile | 36 | - | 184 | 68 | 252 | 2017-08-15 |
| CO | Aurora Immigration Court | 524 | 102 | 53 | 41 | 94 | 2017-08-11 |
| FL | Florida DOC- Chipley | 47 | 2 | 117 | 31 | 148 | 2017-08-10 |
| FL | North Florida Reception Center (NFC) | 31 | 1 | 156 | 22 | 178 | 2017-08-9 |
| CA | Adelanto Detention Facility West | 1,129 | 121 | 100 | 34 | 134 | 2017-08-9 |
| MP | Saipan, Northern Mariana Islands | 31 | 1 | 71 | 47 | 118 | 2017-08-8 |
| MO | Kansas City Immigration Court - Detained | 111 | 13 | 40 | 29 | 69 | 2017-08-8 |
| TX | Laredo, Texas - Detention Facility | 108 | 25 | 55 | 33 | 88 | 2017-08-7 |
| IL | Chicago Detained Juveniles | 159 | (2) | 83 | 42 | 125 | 2017-08-3 |
| PA | Pennsylvania Dept. of Corr., State Corr. Inst. | 28 | - | 164 | 29 | 193 | 2017-08-1 |
| WI | Wisconsin Department of Corrections | 55 | - | 260 | 30 | 290 | 2017-07-28 |
| TX | Texas DOC- Huntsville | 247 | 8 | 300 | 32 | 332 | 2017-07-27 |
| TX | El Paso Juvenile | 151 | 8 | 224 | 43 | 267 | 2017-07-27 |
| TX | Houston Service Processing Center | 288 | 40 | 149 | 29 | 178 | 2017-07-27 |
| FL | Immigration Court | 101 | 14 | 81 | 32 | 113 | 2017-07-27 |
| CA | San Francisco Video | 215 | 14 | 51 | 27 | 78 | 2017-07-27 |
| NV | Pahrump | 100 | 4 | 48 | 21 | 69 | 2017-07-27 |
| NY | Ulster Correctional Facility | 163 | 1 | 192 | 33 | 225 | 2017-07-25 |
| WA | Northwest Detention Center | 1,000 | 104 | 97 | 30 | 127 | 2017-07-21 |
| GA | Stewart Detention Center - Lumpkin Georgia - LGD | 943 | 55 | 73 | 21 | 94 | 2017-07-21 |
| PA | York County Prison | 390 | 43 | 58 | 29 | 87 | 2017-07-21 |
| CA | Adelanto Detention Facility East | 200 | 13 | 102 | 23 | 125 | 2017-07-20 |
| TX | Port Isabel Service Processing Center | 575 | 28 | 38 | 17 | 55 | 2017-07-20 |
| VA | Arlington Juvenile Detainees | 75 | 18 | 122 | 46 | 168 | 2017-07-19 |
| CA | San Francisco Detained | 345 | 103 | 142 | 36 | 178 | 2017-07-18 |
| TX | Dallas Detained | 67 | 14 | 61 | 35 | 96 | 2017-07-12 |
| MI | Detroit Detainees | 157 | 7 | 43 | 17 | 60 | 2017-07-12 |
| VA | Arlington Detained Location | 511 | 29 | 90 | 23 | 113 | 2017-07-10 |
| TX | T. Don Hutto Residential | 358 | 165 | 43 | 36 | 79 | 2017-07-7 |
| TX | Houston Female Detained | 74 | 6 | 57 | 22 | 79 | 2017-07-7 |
| MA | Boston Detained | 196 | 18 | 77 | 18 | 95 | 2017-06-29 |
| IL | Chicago Detained | 528 | 35 | 75 | 18 | 93 | 2017-06-29 |
| PA | Pike County Prison | 53 | 7 | 60 | 23 | 83 | 2017-06-29 |
| NM | Otero County Processing Center | 376 | 10 | 54 | 11 | 65 | 2017-06-29 |
| NJ | Elizabeth Video Hearings | 26 | - | 98 | 43 | 141 | 2017-06-28 |
| TX | Polk County Detention Facility | 239 | 11 | 41 | 15 | 56 | 2017-06-27 |
| FL | Glades County Prison | 189 | 6 | 25 | 15 | 40 | 2017-06-27 |
| NE | Omaha Immigration Court - Detained | 179 | 44 | 64 | 31 | 95 | 2017-06-23 |
| OH | Butler County Sheriff's Office | 60 | 12 | 71 | 23 | 94 | 2017-06-22 |
| FL | Fpc (Folkston Ice Processing Center) | 246 | 17 | 30 | 16 | 46 | 2017-06-22 |
| TX | Rio Grande Detention Center | 187 | 19 | 19 | 23 | 42 | 2017-06-22 |
| TX | San Antonio Detained Juvenile | 113 | 2 | 91 | 21 | 112 | 2017-06-21 |
| MO | Northeast Ohio Correctional Center | 88 | 9 | 55 | 20 | 75 | 2017-06-19 |
| LA | DHS-Litigation Unit/Oakdale | 300 | 19 | 40 | 13 | 53 | 2017-06-19 |
| NJ | Hudson County Jail | 42 | - | 136 | 22 | 158 | 2017-06-16 |
| FL | Broward Transitional Center | 375 | 16 | 46 | 14 | 60 | 2017-06-16 |
| FL | Krome North Service Processing Center | 371 | 48 | 57 | 16 | 73 | 2017-06-15 |
| TX | Prairieland Detention Center | 155 | 37 | 32 | 17 | 49 | 2017-06-15 |
| CT | Hartford Detained DOCket | 26 | 1 | 18 | 12 | 30 | 2017-06-15 |
| CA | Orange County Detained | 252 | 20 | 78 | 13 | 91 | 2017-06-8 |
| TX | Johnson County Jail | 102 | 20 | 35 | 15 | 50 | 2017-06-1 |
| OH | Cleveland Detained Location | 44 | 4 | 34 | 12 | 46 | 2017-06-1 |
| MN | Bloomington Detained | 157 | 9 | 40 | 11 | 51 | 2017-05-31 |
| TX | Joe Corley Detention Facility | 364 | 30 | 38 | 10 | 48 | 2017-05-31 |
| LA | Lasalle Detention Facility | 362 | 36 | 35 | 11 | 46 | 2017-05-31 |
| TX | Southwest Key Program Casa Quetzal | 40 | 4 | 49 | 22 | 71 | 2017-05-22 |
| TX | Joe Corley Detained Female | 113 | 34 | 53 | 12 | 65 | 2017-05-22 |
| TX | David L. Moss Criminal Justice Center | 48 | 4 | 31 | 7 | 38 | 2017-05-16 |
| TX | Boken Kamp Children's Center | 25 | 5 | 159 | 12 | 171 | 2017-05-12 |
| NM | Cibola County Correctional Center | 158 | 31 | 14 | 8 | 22 | 2017-05-12 |
| TX | Karnes County Correction Center | 25 | 18 | 341 | 9 | 350 | 2017-05-11 |
| TX | BCFS | 43 | 26 | 161 | 1 | 162 | 2017-05-1 |