Immigration Court Post-Trump Cases Show No Increase
The latest available court records through the end of March 2017 reveal little observable change in filings since President Trump assumed office. In fact, the pace of DHS issuances of NTAs (notices to appear) that initiate proceedings in Immigration Court under the Trump Administration remain similar to the pace in earlier months under President Obama. Indeed, the monthly numbers of new NTAs under President Trump continues much the same as the levels that prevailed all through the second half of FY 2016[1].
However, because of filing and recording delays, any estimate of overall trends must be considered very preliminary in nature[2]. Indeed, just over half of the NTAs filed during the post-Trump period still reflect NTAs initiated under President Obama. These results are based upon the latest case-by-case court records obtained under the Freedom of Information Act and analyzed by the Transactional Records Access Clearinghouse (TRAC) at Syracuse University.
The court's records reveal that since Trump assumed office, a total of 25,942 cases have been initiated by DHS seeking removal orders. This represents the number of DHS Notices to Appear (NTAs), or comparable forms, dated after January 20, 2017 that had been filed in court as of the end of March 2017. NTAs are the official notification to an individual that DHS is seeking to deport them. NTAs dated after Trump assumed the presidency and that have already been filed and recorded by the court are referred to as "Trump" cases." In contrast, court-recorded NTAs dated during FY 2017 but before Trump assumed office are denoted as "Obama" cases.
While the pace of filings remains unchanged, there has been a sharp change between Trump and Obama cases in whether individuals are detained by Immigration and Customs Enforcement (ICE) while their cases are pending. At the time of the court filing the majority (54%) of Obama's cases were not detained. This was true for only a quarter (25%) of Trump's cases. Most of the remaining individuals were still detained. Figure 1 compares the detention status of Obama versus Trump cases as of the end of March 2017.
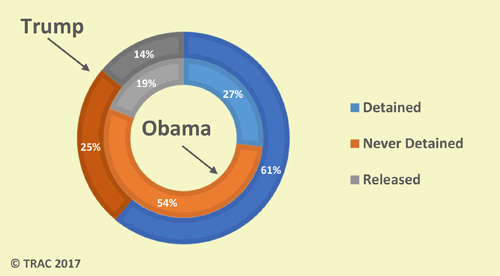
Figure 1. Detention Status Obama vs Trump, FY 2017
Trump Cases by Court Location
Courts that cover detained populations continue to see proportionately greater numbers of newly filed cases. Six out of ten of the courts with the largest number of post-Trump cases handle detained populations. The Houston Detained court had the largest number of Trump cases filed thus far, slightly more than even the New York City court which handles non-detained cases and historically has had the highest case filings in the country.
Other Immigration Courts handling detained populations in the top ten were: Pearsall (Texas) in fourth place, Oakdale (Louisiana) in fifth place, Miami-Krome (Florida) in sixth place, Adelanto (California) in seventh place, and Lumpkin (Georgia) which ranked tenth.
Figure 1 presents new NTAs for each Immigration Court updated through the end of March. Comparisons are shown for filings for FY 2012 through the first six months of FY 2017. FY 2017 is further divided into Obama versus Trump initiated cases.
(click title to open in a new window)
| New Filings (by NTA date) | Percent | |||||
| FY2012-FY2016 | FY 2017* | FY2012-FY2016 | FY 2017* | |||
| Immigration Court | OBAMA | TRUMP | OBAMA | TRUMP | ||
| All | 1,121,688 | 70,546 | 25,942 | 100.0% | 100.0% | 100.0% |
| Houston - Detained | 41,911 | 3,651 | 2,036 | 3.7% | 5.2% | 7.8% |
| New York | 76,149 | 6,153 | 1,831 | 6.8% | 8.7% | 7.1% |
| Pearsall | 31,870 | 1,824 | 1,582 | 2.8% | 2.6% | 6.1% |
| Oakdale | 26,119 | 1,303 | 1,191 | 2.3% | 1.8% | 4.6% |
| Los Angeles | 75,231 | 3,696 | 1,139 | 6.7% | 5.2% | 4.4% |
| Miami - Krome | 25,055 | 1,345 | 1,045 | 2.2% | 1.9% | 4.0% |
| Adelanto | 21,047 | 1,091 | 929 | 1.9% | 1.5% | 3.6% |
| Atlanta | 23,900 | 2,308 | 911 | 2.1% | 3.3% | 3.5% |
| San Francisco | 50,278 | 3,429 | 846 | 4.5% | 4.9% | 3.3% |
| Lumpkin | 26,635 | 1,057 | 764 | 2.4% | 1.5% | 2.9% |
| Dallas | 37,390 | 1,984 | 740 | 3.3% | 2.8% | 2.9% |
| El Paso | 27,731 | 1,758 | 703 | 2.5% | 2.5% | 2.7% |
| Chicago | 41,379 | 2,562 | 675 | 3.7% | 3.6% | 2.6% |
| San Diego | 19,281 | 1,397 | 644 | 1.7% | 2.0% | 2.5% |
| Los Fresnos | 21,588 | 918 | 608 | 1.9% | 1.3% | 2.3% |
| San Antonio | 44,057 | 1,469 | 604 | 3.9% | 2.1% | 2.3% |
| Eloy | 24,135 | 1,264 | 597 | 2.2% | 1.8% | 2.3% |
| Tacoma | 18,446 | 1,019 | 593 | 1.6% | 1.4% | 2.3% |
| York | 15,798 | 794 | 582 | 1.4% | 1.1% | 2.2% |
| Kansas City | 10,987 | 1,309 | 523 | 1.0% | 1.9% | 2.0% |
| Houston | 44,531 | 4,429 | 506 | 4.0% | 6.3% | 2.0% |
| Florence | 19,401 | 1,605 | 504 | 1.7% | 2.3% | 1.9% |
| Imperial | 7,088 | 894 | 504 | 0.6% | 1.3% | 1.9% |
| Aurora | 10,471 | 701 | 459 | 0.9% | 1.0% | 1.8% |
| Orlando | 15,450 | 1,178 | 456 | 1.4% | 1.7% | 1.8% |
| Bloomington | 11,198 | 901 | 431 | 1.0% | 1.3% | 1.7% |
| Newark | 21,290 | 629 | 411 | 1.9% | 0.9% | 1.6% |
| Las Vegas | 9,384 | 812 | 410 | 0.8% | 1.2% | 1.6% |
| Elizabeth | 12,154 | 751 | 388 | 1.1% | 1.1% | 1.5% |
| Arlington | 39,967 | 2,766 | 377 | 3.6% | 3.9% | 1.5% |
| Detroit | 10,224 | 560 | 362 | 0.9% | 0.8% | 1.4% |
| Boston | 21,194 | 606 | 292 | 1.9% | 0.9% | 1.1% |
| Omaha | 10,598 | 1,260 | 234 | 0.9% | 1.8% | 0.9% |
| Batavia | 6,377 | 451 | 224 | 0.6% | 0.6% | 0.9% |
| Baltimore | 23,096 | 1,213 | 209 | 2.1% | 1.7% | 0.8% |
| Cleveland | 11,768 | 543 | 166 | 1.0% | 0.8% | 0.6% |
| Harlingen | 27,939 | 947 | 161 | 2.5% | 1.3% | 0.6% |
| New York - DET | 6,322 | 497 | 153 | 0.6% | 0.7% | 0.6% |
| Phoenix | 14,520 | 751 | 142 | 1.3% | 1.1% | 0.5% |
| Philadelphia | 9,174 | 1,160 | 124 | 0.8% | 1.6% | 0.5% |
| Denver | 7,814 | 835 | 122 | 0.7% | 1.2% | 0.5% |
| Miami | 35,900 | 2,046 | 119 | 3.2% | 2.9% | 0.5% |
| Memphis | 16,952 | 1,736 | 113 | 1.5% | 2.5% | 0.4% |
| Hartford | 5,337 | 423 | 97 | 0.5% | 0.6% | 0.4% |
| West Valley | 6,567 | 282 | 88 | 0.6% | 0.4% | 0.3% |
| Napanoch | 2,119 | 138 | 69 | 0.2% | 0.2% | 0.3% |
| New Orleans | 10,539 | 626 | 58 | 0.9% | 0.9% | 0.2% |
| Portland | 5,090 | 436 | 49 | 0.5% | 0.6% | 0.2% |
| Buffalo | 3,658 | 95 | 44 | 0.3% | 0.1% | 0.2% |
| Seattle | 8,770 | 530 | 41 | 0.8% | 0.8% | 0.2% |
| Honolulu | 1,070 | 82 | 37 | 0.1% | 0.1% | 0.1% |
| Hagatna | 277 | 28 | 18 | 0.0% | 0.0% | 0.1% |
| Tucson | 4,123 | 129 | 12 | 0.4% | 0.2% | 0.0% |
| Charlotte | 20,178 | 131 | 9 | 1.8% | 0.2% | 0.0% |
| Guaynabo | 1,925 | 25 | 8 | 0.2% | 0.0% | 0.0% |
| Saipan | 236 | 19 | 2 | 0.0% | 0.0% | 0.0% |
Footnotes
[1] Under President Obama, the pace of filings had increased during FY 2016. In fact, during the second half of FY 2016 (April - September) new NTAs were up 15 percent when compared to the first six months (October 2015 - March 2016) of FY 2016.
[2] To adjust for these recording delays, TRAC used a comparison of new NTAs recorded in a snapshot of Immigration Court data TRAC had received at the end of March 2016 with the parallel snapshot as of the end of March 2017. TRAC also examined the volume of new cases using the date cases were filed in court, in contrast to the date of the NTA itself. Neither of these methods indicated that an increase had occurred since President Trump assumed office.