A significant and increasing proportion of cases in which Immigration and Customs Enforcement (ICE) has sought to remove individuals from the United States are being rejected by the Immigration Courts, according to an analysis of very recent case-by-case government data. Here are some key findings:
- During the last three months of FY 2010, the rejection rate of ICE requests for removal (deportation) was nearly one out of three or 31 percent. This turndown rate is up from what it was — one out of every four — 12 months earlier.
- For all of FY 2010, some courts turned down ICE removal requests more than half of the time. Among them were the Immigration Courts in New York City (70% turned down), Oregon (63% turned down), Los Angeles (63% turned down), Miami (59% turned down) and Philadelphia (55% turned down).
- Considering the records for the last five years, the information shows that the number of those cases where ICE sought a removal that the courts then determined were not subject to deportation because the individuals were entitled to reside in the United States was considerable, more than a quarter of a million individuals.
While ICE is understandably eager to trumpet the overall number of deportations being achieved by the agency, the findings above are based on very recent information obtained by TRAC under the Freedom of Information Act that track what happens to ICE cases where the law requires the agency to obtain the concurrence of an immigration judge before an individual is deported from the United States.
And in this case, it should be noted that ICE for many months has actively sought to prevent the release to TRAC of much more detailed data it has that would better explain the growing rejection rates (see sidebar) and the possible reasons behind these important shifts.
| |
The new findings about the broad failures in ICE efforts to deport individuals raise two important questions that might be answered with the more extensive data that the agency has sought to withhold from the public. One involves the effectiveness of the agency: is it targeting the individuals for removal who in fact should be deported? The second question concerns the basic fairness of the process: what is the impact on those individuals the agency has wrongly sought to remove who were entitled to remain in the United States?
Extensive details about these findings are presented in the sections that follow.
National Trends
The quarterly rate of rejection of government requests for orders authorizing it to deport an individual from this country has varied somewhat over the period FY 2000 through FY 2010 as shown in Figure 1 (below) and its accompanying tabular details.

Figure 1. Immigration and Customs Enforcement Removal Order Requests Not Granted by the Immigration Courts (click for larger image). |
Overall, except for a short period in FY 2007, ICE's filings to deport people from the United States were granted three-fourths of the time in the FY 2004-2009 period[1]. Put another way, however, this means that roughly one out of every four of the removal cases failed to win the approval of the judges although in some years the turndown rate was somewhat lower[2].
Surprisingly, however, the rejection rate has jumped up during the past year. In the third quarter of this year (July-September 2010), for example, almost one out of three of the requests (31%) were not successful. This compares with just one out of four (25%) only 12 months earlier.
Why ICE Actions To Deport Individuals Aren't Upheld
Because ICE is refusing to release its own records that would identify which of its removal programs and practices are primarily responsible for this most recent jump in its ineffective targeting of individuals for deportation, the public is left with many unanswered questions on why these new trends have emerged.
Presumably ICE's success rate over time is impacted by the composition of cases that ICE brings. ICE has been under growing pressures to increase the volume of illegal immigrants the agency catches and removes from the country. The Obama administration has announced new priorities targeting aliens with particularly serious criminal records. It has also focused increasing resources on new initiatives such as Secure Communities while de-emphasizing large scale raids on businesses. However, because ICE is withholding its data that would track cases from their origins to disposition we are prevented from determining which particular initiatives may account for the sharp increase in ICE's turndown rate (see sidebar on ICE's refusal to turn over these data).
It seems unlikely that these changes can be attributed to changes in the Immigration Courts. During this past year there has been no notable change in EOIR policies and little change in the makeup of judges serving on the court[3].
Available records of the Executive Office for Immigration Review (EOIR) in the Department of Justice do classify the reason the judge gave for not granting ICE's request for a removal order into several categories. First, the court may "terminate" the court proceeding because the judge finds ICE has not shown the government has any grounds to remove the individual.
| |
The court also may reject ICE's filing because the alien shows that under the immigration law they have a legitimate right to remain in the country because they are entitled to asylum or other "relief" provisions passed by Congress. Finally, the court also may close the case without granting ICE's request for a removal order for other reasons. Most of these fall under the heading "administrative closures." When DHS concludes that it does not have the evidence to support its removal action, for example, it can ask the court to close the proceeding administratively (for further details about the data please refer to the adjacent sidebar on this topic).
The reason for the sharp uptick during FY 2010 in ICE's unsuccessful attempts appears primarily due to the increase in cases "terminated" by a judge — that is, in cases where the judge finds that the government has no legitimate grounds for seeking a removal order. The relative rise in this category of case dispositions can be seen clearly in Figure 1 by the increase in the area shaded light blue which tracked these specific cases. See also supporting numbers.
Over a Quarter Million Individuals Impacted
The sheer volume of cases filed by ICE in the Immigration Courts is vast. As a result, the number of people affected in cases that the courts have rejected for various reasons is sizable. Over the past five years court records indicate there were a total of 94,949 cases that the judges said they had terminated because there were no grounds for removal. In addition, there were 151,682 cases where the judges granted relief. In the FY 2006-2010 period, these unsuccessful ICE filings thus affected almost a quarter of a million individuals (246,721). The count is even higher (313,244), however, if all other reasons given by the judges for not granting ICE removals and deportation are counted.
In some areas of the country the court turns down ICE's removal request over half of the time. These include courts in New York, Oregon (which also covers Idaho, Montana and Alaska), Los Angeles, Miami and Philadelphia. ICE's batting average last year in these courts is shown in Table 1. Turndown rates ranged as high as 70 percent.
|
Trends in the Country's Larger Courts
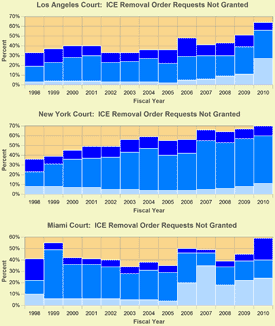
With the exception of courts located in detention facilities where few of the individuals are represented and ICE almost always obtains a removal or voluntary departure order from the presiding judge, TRAC found that larger Immigration Courts regardless of the region of the country were seeing an increase in the rejection rates on ICE removal actions. The three courts that disposed of the largest number of cases during FY 2010 were the Los Angeles, New York City and Miami courts. For each of these, FY 2010 saw an increase in the relative volume of ICE requests for removal orders that were turned down. See Figure 2 and accompanying tabular details. Again the same color scheme is used to distinguish the three different reasons ICE cases were turned down by judges in these courts. Note that in the case of Miami, a jump in the turndown rate occurred beginning in FY 2006, and the FY 2010 rate reached an all-time high.

Figure 2. Click for larger image. |
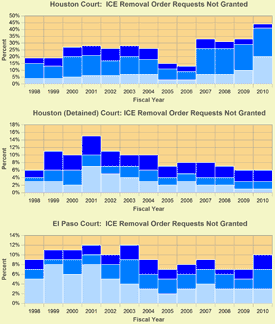
The fourth largest number of cases was dealt with by a specialty court headquartered in Houston, Texas. Called the "Houston-Detained" court, its jurisdiction was limited to individuals held at immigration detention facilities. There is also a Houston Immigration Court which handles non-detained cases. For comparison purposes, ICE turndown rates for the removal orders it sought in each of these two courts is shown in Figure 3, with numbers are presented in the accompanying table. Trends are quite distinctive for these two Houston courts. While the pattern of Houston court that hears non-detained cases resembles the national pattern with an increase in the rejection rate of ICE's removal claims, ICE's turndown rate has fallen for the detained population.

Figure 3. Click for larger image. |
Why is the pattern so different for these two Houston courts? It can be argued that individuals who are detained — by the very fact that they were detained — correspond to cases where there aren't legal grounds for remaining in this country. However, it is also true that such individuals are usually unrepresented; without legal assistance, they are unlikely to be able to competently challenge either their detention or ICE's deportation claims in court
The fifth largest court in terms of the number of cases decided was the El Paso, Texas court. That court also primarily conducts hearings at detention facilities, including those in neighboring New Mexico. Like the pattern we saw for the Houston-Detained court, the turndown rate for ICE removal actions declined for the early part of this period. However, in contrast to Houston-Detained court, after leveling off during FY 2005-2009, it then jumped up in FY 2010. Individuals that were granted some form of relief principally accounted for the rise last year (see Figure 3 and accompanying table).
It is important to keep in mind that the cases the courts turned down last year typically had their origin many months earlier. Because of court backlogs, last year it took an average of 424 days for a court to rule that ICE had no grounds to remove an individual and 696 days to decide that a noncitizen should receive a grant of asylum or other relief. Cases where a removal order is granted move more quickly. Last year these took an average of 140 days, while cases ending in voluntary departure orders took an average of 323 days.
Conclusion
The poor targeting of government removal efforts documented by the Immigration Court data shows that scarce resources such as the investigative time of ICE agents are being wasted and that the ability of the government to deport those who should be removed from the country therefore has been reduced. Poor targeting that weakens the government is inefficient.
In addition, however, poor targeting imposes real personal and financial burdens on the individuals who have been wrongfully selected for removal. It is unfair. To the extent that these failures are the result of poorly designed programs, badly drafted laws and ICE's management problems, the public faith in the government is undermined and the general belief in the rule of law is damaged.
[2] During 2005 the court issued an unusually large volume of removal orders "in absentia" because the alien was not present at the court hearing to contest the matter. During this period funding by Congress for detention facilities had not kept pace with DHS's stepped up enforcement activity resulting in large numbers of aliens being released after they were picked up. See the discussion of "Detention Beds and Workload" in TRAC's July 2008 report.