Detainees Leaving ICE Detention from the
Corpus Christi Facility
Corpus Christi, Texas
Detainees Deported or Released Number last 12 months 623 Out of total detained 658 Facility ranking on detainees top 21 %
Table 1: Number leaving ICE detention
from this facilityDuring the most recent 12 month period for which data are available, a total of 623 detainees housed at the Corpus Christi Facility left that facility because they were deported, were released under supervision while their cases were being decided, or left ICE detention for one of a variety of other reasons. This is a special facility for housing juveniles.
Those individuals who departed from this facility because they were leaving ICE detention made up 95 percent of the 658 detainees housed at this facility during the last 12 months. This report focuses on the reasons these individuals left ICE detention. Sometimes this report speaks of these individuals as those "exiting" ICE detention, or simply as "exits." The others remained in ICE detention but were transferred from the Corpus Christi Facility to other facilities.
This report covers those who left ICE custody. It excludes individuals transferred to other ICE facilities. For more information on this facility, including individuals that were transferred, see additional TRAC reports in this series.
This report series is based upon analyses conducted by the Transactional Records Access Clearinghouse (TRAC) at Syracuse University of 1.7 million government records tracking each individual who passed through an ICE detention facility during fiscal year 2015. This most recent 12 month period for which comprehensive data are available covers October 2014 through September 2015. See About the Data.
How This Facility Ranks Nationally
Rankings on the number leaving ICE detention. The Corpus Christi Facility was one of 637 facilities nationwide that housed ICE detainees during the most recent 12 month period. Of these 637, there were 358 that had at least 10 individuals who were deported or released. Excluding those facilities with fewer than 10 exits, the Corpus Christi Facility last year ranked in the top 21 percent nationwide in the number of individuals leaving ICE detention. This means that 21 percent of the locations contributed the same or a larger numbers of exits, while 79 percent had a smaller number. See Table 1.
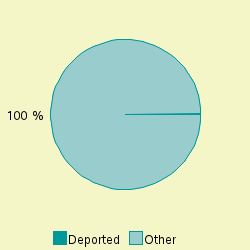
Deportations. Nationally, the most common reason that a detainee left ICE detention was that they were deported from the United States. During the most recent 12 month period for which comprehensive data are available, nationwide 56.3 percent of those leaving ICE detention were deported or "voluntarily" departed. By way of comparison, a lower percentage of detainees (0 percent) left the country from the Corpus Christi Facility because they were formally deported, or left under the so-called "voluntary departure" procedure.
Were Detained Individuals from the Local Area?
Information on the place of arrest was not included in the available data ICE released. However, we can examine whether the Corpus Christi Facility was the first ICE facility in which these detainees were held. According to ICE records, for the vast majority (91 percent) of these detainees, the Corpus Christi Facility was the first place they were sent when they were detained by ICE. The remaining 9 percent had been transferred in from another ICE detention facility.
We can also look at how quickly they arrived at this facility after they were first detained. A total of 98 percent arrived at the Corpus Christi Facility at some point during the very first day they were detained by ICE. There was considerable variability among detainees in the number of detention facilities they had been held in before they were finally deported or released from this facility. All detainees either entered and left this one facility, or had spent time at one additional ICE facility before their transfer to the Corpus Christi Facility. These figures again are based on an analysis of the most recent 12 months for which data are available.
For the United States as a whole, last year the average number of ICE facilities detainees moved through was 1.8. Detainees at the Corpus Christi Facility on average had stayed at somewhat fewer (1.1) ICE facilities.
Reason Left ICE Facility Profile U.S Profile Number Percent Percent Orders of Recognizance or Supervision 584 93.7 % 19.8 % Release to ORR 37 5.9 % 0.1 % Deported/Removed 1 0.1 % 55.3 % Escaped 1 0.1 % 0.0 % Alternative ATD custody 0 . 0.1 % Bonded out 0 . 11.0 % Died 0 . 0.0 % Paroled 0 . 5.2 % Prosecutorial Discretion 0 . 1.0 % Proceedings Terminated 0 . 1.3 % U.S. Marshal or Other Agency 0 . 4.5 % Voluntary departure 0 . 0.9 % Withdrawal 0 . 0.2 % Total 623 100.0 % 100.0 %
Table 3: Reasons individuals left ICE detention during the last 12 months
Orders. The issuance of an order to release the detainee was the most common reason why individuals were recorded as leaving ICE detention from this facility. Under an "order of recognizance" an individual is released with reporting conditions while in deportation proceedings and awaiting a final decision. A second type of order ("order of supervision") releases an individual after a final order of removal. Here an individual is released because ICE has not met the time limits the law imposes for deporting the individual. There were 584 (94 percent) who left the Corpus Christi Facility detention for these reasons: 584 with orders of recognizance, and none with an order of supervision.
Transferred to ORR custody. A total of 37 individuals (6 percent) left this facility last year because they were turned over to the care and custody of the Office of Refugee Resettlement (ORR). Among ORR's responsibility is the supervision of unaccompanied children, including their placement whenever possible with qualified sponsors or family members who ORR determines are capable of providing for the child's physical and mental well-being.
Escape and death. Nationally, there were 65 individuals who escaped ICE detention during the latest 12 month period for which data are available, and 6 individuals were recorded as having died in detention. No one was recorded as dying last year at the Corpus Christi Facility, but there was one escape.
As shown in Table 3, no one was recorded as leaving the Corpus Christi Facility during the past 12 months for the following reasons: Alternative ATD custody, Bonded Out, Paroled, Prosecutorial Discretion, Proceedings Terminated, U.S. Marshals or other agency, Voluntary Return and Withdrawal. See "Reasons for Leaving ICE Detention" for a description of these categories.
Comparing Release Reasons Against The National Picture
In many respects release reasons for the Corpus Christi Facility departed from the national picture. It was the case that a lower proportion left because they were deported from this facility (0 percent) than was true for the U.S. as a whole (55 percent). No one left as a voluntary departure from this facility, while this was true for 1 percent of all individuals nationally.
In addition, differences were seen for detainees released on orders of recognizance or supervision (94 versus 20 percent), ORR (6 versus 0 percent), individuals released on bond (none versus 11 percent), for those paroled (none versus 5 percent), and those released to the U.S. Marshal or other agency (none versus 5 percent).
The facility's percentages fell within 3 percentage points of the national figures for all other categories.
Nationalities
Which nationalities predominate? Last year in the United States, individuals from Mexico comprised the largest number of those leaving ICE detention. Some 43.4 percent of all detainees recorded Mexico as their country of origin. The Corpus Christi Facility had a much smaller proportion of detainees from Mexico - 1 percent among their exits. Detainees from Mexico were not the largest single nationality group among those leaving detention from the facility.
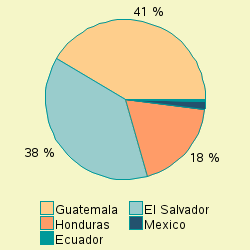
In descending order, the top nationalities that made up those leaving ICE detention from the Corpus Christi Facility last year were: Guatemala (41%) , El Salvador (38%), Honduras (18%), Mexico (1%) and Ecuador (0%).
This compared to the United States as a whole where the other top five nationalities after Mexico were Guatemala (19%), El Salvador (15%), Honduras (12%) and Ecuador (1%).
For the frequency for each of the other nationalities among those leaving ICE detention from the Corpus Christi Facility last year see Table 4.
Deportations and voluntary departures by nationality. Within the nationalities that made up those listed in Table 4 with more than one individual, the proportion deported or voluntarily departing varied from 0 percent to 11 percent. As mentioned above, this compares with 0 percent for all detainees.
Nationalities Ranked in Top 10 Left ICE Detention Total Deported/
Voluntary
DeparturePercent - ALL 623 1 0.1 % 1 Guatemala 257 0 0.0 % 2 El Salvador 235 0 0.0 % 3 Honduras 115 0 0.0 % 4 Mexico 9 1 11.1 % 5 Ecuador 3 0 0.0 % 6 Cuba 2 0 0.0 % 7 Costa Rica 1 0 0.0 % Nicaragua 1 0 0.0 %
Table 4: Numbers leaving ICE detention by nationality
during the last 12 months
With the highest rate of 11 percent were detainees from Mexico where 9 individuals were deported or took voluntary departure. More than one country was tied with the lowest rate, where detainees were deported or took voluntary departure.