Detainees Leaving ICE Detention from the
Stewart Detention Center
Lumpkin, Georgia
Detainees Deported or Released Number last 12 months 12,287 Out of total detained 13,956 Percent change: from previous 12 months 361 % from FY 2005 - from FY 2000 1228600 % Facility ranking on detainees top 2 %
Table 1: Number leaving ICE detention
from this facilityDuring the most recent 12 month period for which data are available, a total of 12,287 detainees housed at the Stewart Detention Center left that facility because they were deported, were released under supervision while their cases were being decided, or left ICE detention for one of a variety of other reasons. The use of this facility for the temporary housing of federal immigration detainees was arranged through an intergovernmental service agreement (IGSA) under which payments by ICE to another governmental agency are made for housing federal detainees. While the facility is government owned, it is operated by the Corrections Corporation of America that was in the business of providing detention services for housing federal detainees.
Those individuals who departed from this facility because they were leaving ICE detention made up 88 percent of the 13,956 detainees housed at this facility during the last 12 months. This report focuses on the reasons these individuals left ICE detention. Sometimes this report speaks of these individuals as those "exiting" ICE detention, or simply as "exits." The other 12 percent remained in ICE detention but were transferred from the Stewart Detention Center to other facilities.
This report covers those who left ICE custody. It excludes individuals transferred to other ICE facilities. For more information on this facility, including individuals that were transferred, see additional TRAC reports in this series.
This report series is based upon analyses conducted by the Transactional Records Access Clearinghouse (TRAC) at Syracuse University of 3.4 million government records tracking each individual who passed through an ICE detention facility during the past decade. The most recent 12 month period for which comprehensive data are available is for April 2007 through March 2008. See About the Data.
How This Facility Ranks Nationally
Rankings on the number leaving ICE detention. The Stewart Detention Center was one of 1,528 facilities that were used to house immigration detainees during the last decade, and one of 654 facilities nationwide that housed ICE detainees during the most recent 12 month period. Of these 654, there were 324 facilities that had at least 10 individuals who were deported or released. Excluding those facilities with fewer than 10 exits, the Stewart Detention Center last year ranked in the top 2 percent nationwide in the number of individuals leaving ICE detention. This means that 2 percent of the locations contributed the same or a larger numbers of exits, while 98 percent had a smaller number. See Table 1.
Deportations. Nationally, the most common reason that a detainee left ICE detention was that they were deported from the United States. During the most recent 12 month period for which comprehensive data are available, nationwide 81 percent of those leaving ICE detention were deported or "voluntarily" departed. By way of comparison, a higher percentage of detainees (96 percent) left the country from the Stewart Detention Center because they were formally deported, or left under the so-called "voluntary departure" procedure.
Trends in the Number of Detainees Deported or Released
Trends in the number leaving ICE detention. When deportations and other releases during the April 2007-March 2008 period were compared with those in the previous 12 months, the Stewart Detention Center numbers were sharply up by 361 percent. During the April 2006-March 2007 period the facility processed 2,663 "exits" as compared with 12,287 last year. Exits last year were however up by 1,228,600 percent as compared with the number of exits (1) during FY 2000.
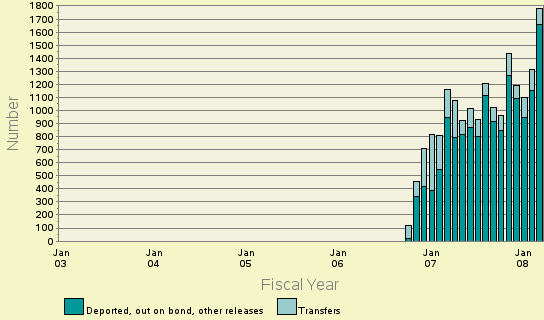
Longer term exit trends. Greater detail on these long-term trends for those leaving ICE detention from the Stewart Detention Center are displayed in Figure 1. Here the month-by-month number of exits are graphed against the backdrop of the total detainees leaving the custody of this facility. Exits are displayed with darker shading while those transferred appear with lighter shading. As is readily apparent, considerable variation has occurred over time in both the overall numbers of detainees as well as the volume leaving ICE detention during this period.
Exit trends are also summarized by fiscal year in Table 2. Year-by-year figures for the Stewart Detention Center are given for the total number of detainees as compared with those leaving ICE detention from the facility. The percent of detainees that left ICE detention is also given. (As mentioned above, the remaining detainees were transferred to another ICE detention facility.) Because data for all twelve months of the most recent fiscal year are not yet available, the FY 2008 numbers (October 2007 through September 2008) are estimated based upon reporting for the first six months.
Were Detained Individuals from the Local Area?
Information on the place of arrest was not included in the available data ICE released. However, we can examine whether the Stewart Detention Center was the first ICE facility in which these detainees were held. According to ICE records, for a substantial proportion (31 percent) of these detainees, the Stewart Detention Center was the first place they were sent when they were detained by ICE. The remaining 69 percent had been transferred in from another ICE detention facility.
We can also look at how quickly they arrived at this facility after they were first detained. A total of 32 percent arrived at the Stewart Detention Center at some point during the very first day they were detained by ICE. There was considerable variability among detainees in the number of detention facilities they had been held in before they were finally deported or released from this facility. The number of facilities ranged as high as 10 separate locations for some detainees. These figures again are based on an analysis of the most recent 12 months for which data are available.
For the United States as a whole, last year the typical detainee stayed in two different ICE detention facilities before being deported or released - half stayed in 2 or fewer facilities, and half stayed in 2 or more. The average number of ICE facilities detainees moved through was 1.9. Detainees at the Stewart Detention Center on average had stayed at somewhat fewer (1.9) ICE facilities.
Reason Left ICE Facility Profile U.S Profile Number Percent Percent Deported/Removed 10,231 83 % 72 % Voluntary departure 1,531 12 % 10 % Bonded out 381 3 % 8 % U.S. Marshal or Other Agency 68 1 % 3 % Proceedings Terminated 47 0 % 2 % Orders of Recognizance or Supervision 23 0 % 5 % Withdrawal 3 0 % 1 % Died 1 0 % 0 % Escaped 1 0 % 0 % Paroled 0 . 0 % Total 12,286 100 % 100 %
Table 3: Reasons individuals left ICE detention during the last 12 months
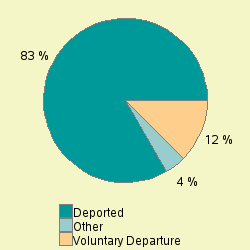
Why Did Detainees Leave ICE Detention?
ICE records one of twenty-three reasons a detainee left ICE detention. As shown in Table 3, these reasons fall into ten general categories -- from leaving because one is deported or removed, to leaving because one escaped or the individual died while in custody.
Deportation. As mentioned earlier, the most common reason detainees left the Stewart Detention Center was that they were deported. A total of 10,231 individuals (83 percent) were deported or removed from the Stewart Detention Center during the most recent 12 month period for which data are available. (ICE data did not distinguish between deportations and removals, and the terms are used interchangeably in this report.)
Voluntary departure. Under some circumstances, detainees are allowed to take "voluntary departure." As with deportation, under voluntary departure a person must leave the country. However, unlike formal deportation where the individual is barred by law from reentering this country permanently or for a period of years, under voluntary departure the individual is not legally barred from reentry. An additional 1,531 detainees (12 percent) left the Stewart Detention Center last year as voluntary departures.
Bonded out. A group of individuals (381 or 3 percent) were also "bonded out." This generally covers situations where the individual posts a bond and is released while awaiting a decision on their deportation (removal) case. The amount of the bond is set by ICE, or by an Immigration Judge. Many individuals are not eligible to be released because their continued detention is considered mandatory under provisions in the immigration laws.
Transferred to criminal custody. A total of 68 individuals (1 percent) left this facility last year because they were turned over to U.S. Marshals or to some other government agency. This typically occurs because there is an outstanding criminal case against the individual, or the individual is needed as a material witness in a criminal case.
Escape and death. Nationally, there were 92 individuals who escaped ICE detention during the latest 12 month period for which data are available, and 8 individuals were recorded as having died in detention. No one was recorded by the Stewart Detention Center as either escaping or dying last year. Over the past decade, there was no record of anyone who died or escaped from this facility.
As shown in Table 3, no one was recorded as leaving the Stewart Detention Center during the past 12 months for the following reason: Paroled. See "Reasons for Leaving ICE Detention" for a description of this category.
Comparing Release Reasons Against The National Picture
In many respects release reasons for the Stewart Detention Center departed from the national picture. It was the case that a higher proportion left because they were deported from this facility (83 percent) than was true for the U.S. as a whole (72 percent).
In addition, differences were seen for individuals released on bond (3 versus 8 percent), and detainees released on orders of recognizance or supervision (0 versus 5 percent).
The facility's percentages fell within 3 percentage points of the national figures for all other categories.
Nationalities
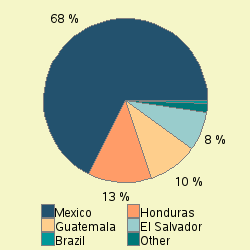
Which nationalities predominate? Last year in the United States, individuals from Mexico comprised the largest number of those leaving ICE detention. Some 53.6 percent of all detainees recorded Mexico as their country of origin. The Stewart Detention Center had a larger proportion of detainees from Mexico - 68 percent among their exits. Detainees from Mexico were also the largest single nationality group among those leaving detention from the facility.
Nationalities Ranked in Top 10 Left ICE Detention Total Deported/
Voluntary
DeparturePercent - ALL 12,287 11,762 95.7 % 1 Mexico 8,299 7,999 96.3 % 2 Honduras 1,555 1,521 97.8 % 3 Guatemala 1,207 1,161 96.1 % 4 El Salvador 949 907 95.5 % 5 Brazil 64 38 59.3 % 6 Colombia 58 47 81.0 % 7 Jamaica 34 28 82.3 % 8 Nicaragua 17 10 58.8 % 9 Ecuador 16 9 56.2 % 10 Dominican Republic 10 4 40.0 %
Table 4: Numbers leaving ICE detention by nationality
during the last 12 months
In descending order, the other top nationalities after Mexico that made up those leaving ICE detention from the Stewart Detention Center last year were: Honduras (13%), Guatemala (10%), El Salvador (8%) and Brazil (1%). This compared to the United States as a whole where the other top five nationalities after Mexico were Honduras (11.0%), Guatemala (10.0%), El Salvador (8.4%) and Dominican Republic (1.6%).
For the frequency for each of the other nationalities within the top 10 among those leaving ICE detention from the Stewart Detention Center last year see Table 4.
Deportations and voluntary departures by nationality. Within the nationalities that made up those listed in Table 4 with more than one individual, the proportion deported or voluntarily departing varied from 40 percent to 98 percent. As mentioned above, this compares with 96 percent for all detainees.
With the highest rate of 98 percent were detainees from Honduras where 1,555 individuals were deported or took voluntary departure. At the other end of the range were detainees from Dominican Republic, where 40 percent ended up deported or were allowed voluntary departure.