Social Security Administration Prosecutions Rose 20% in FY 2013
by the Social Security Administration
| Number Year-to-date | 682 |
|---|---|
| Percent Change from previous year | 20.7 |
| Percent Change from 5 years ago | 31.7 |
| Percent Change from 10 years ago | -10.6 |
| Percent Change from 20 years ago | 509 |
The latest available data from the Justice Department show that during FY 2013 the government reported 682 new prosecutions referred by the Social Security Administration. According to the case-by-case information analyzed by the Transactional Records Access Clearinghouse (TRAC), this number is up 20.7 percent over the past fiscal year when the number of prosecutions totaled 565.
The comparisons of the number of defendants charged with offenses are based on case-by-case information obtained by TRAC under the Freedom of Information Act from the Executive Office for United States Attorneys (see Table 1).
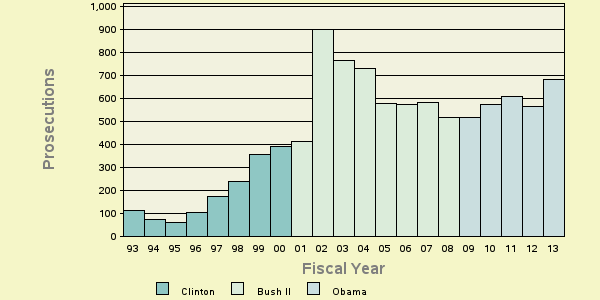
Compared to five years ago when there were 518, the number of FY 2013 prosecutions of this type is up 31.7 percent. Prosecutions over the past year are still lower than they were ten years ago. Overall, the data show that prosecutions of this type are down 10.6 percent from the level of 763 reported in 2003 but up 509 percent from the level of 112 reported in 1993.
The long term trend in prosecutions for these matters going back to FY 1993 is shown more clearly in Figure 1. The vertical bars in Figure 1 represent the number of prosecutions of this type recorded each fiscal year. Each presidential administration is distinguished by the color of the bars. To view trends month-by-month rather than year-by-year, see TRAC's monthly report series for the latest data.
Top Ranked Lead Charges
Table 2 shows the top lead charges recorded in the prosecutions of matters filed in U.S. District Court during FY 2013.
| Lead Charge | Count | Rank | 1 yr ago | 5 yrs ago | 10 yrs ago | 20 yrs ago |
|---|---|---|---|---|---|---|
| 18 USC 641 - Public money, property or records | 433 | 1 | 1 | 1 | 2 | 3 |
| 42 USC 408 - Fed Old Age, Survivors & Disab Insur -Penalties | 68 | 2 | 2 | 2 | 1 | 1 |
| 42 USC 1383 - Social Security -Procedure for payment of benefits | 17 | 3 | 4 | 7 | 4 | 10 |
| 42 USC 1383a - Fraudulent acts; penalties; restitution | 17 | 3 | 3 | 4 | 36 | - |
| 18 USC 1028 - Fraud and related activity - id documents | 16 | 5 | 8 | 3 | 5 | 18 |
| 18 USC 1001 - Fraud/false statements or entries generally | 13 | 6 | 4 | 5 | 3 | 4 |
| 18 USC 1343 - Fraud by wire, radio, or television | 11 | 7 | 9 | 13 | 10 | 18 |
| 18 USC 1341 - Mail Fraud - Frauds and swindles | 10 | 8 | 6 | 9 | 9 | 2 |
| 18 USC 1028A - Aggravated Identity Theft | 6 | 9 | 7 | 8 | 6 | - |
| 18 USC 1542 - False statement in application and use of passport | 5 | 10 | 33 | 17 | 25 | 18 |
"Public money, property or records" (Title 18 U.S.C Section 641) was the most frequently recorded lead charge. This statute was also top-ranked one and five years ago. It was ranked second ten years ago and third twenty years ago.
Ranked second in frequency was the lead charge "Fed Old Age, Survivors & Disab Insur -Penalties" under Title 42 U.S.C Section 408. This statute ranked second one and five years ago. It was top-ranked ten and twenty years ago.
Ranked third were "Social Security -Procedure for payment of benefits" under Title 42 U.S.C Section 1383 and "Fraudulent acts; penalties; restitution" under Title 42 U.S.C Section 1383a. Title 42 U.S.C Section 1383 was ranked fourth a year ago, while it was the seventh most frequently invoked five years ago. It was ranked fourth ten years ago and tenth twenty years ago. Title 42 U.S.C Section 1383a was ranked third a year ago, while it was the fourth most frequently invoked five years ago; ten years ago, it was ranked 36th.
Among these top ten lead charges, the one showing the greatest increase in prosecutions — up 83.3 percent — compared to one year ago was Title 18 U.S.C Section 1343 that involves "Fraud by wire, radio, or television." This was the same statute that had the largest increase — 400 percent — when compared with five years ago.
Again among the top ten lead charges, the one showing the sharpest decline in prosecutions compared to one year ago — down 53.8 percent — was "Aggravated Identity Theft " (Title 18 U.S.C Section 1028 ). This was the same statute that had the largest decrease — 61.9 percent — when compared with five years ago.
Top Ranked Judicial Districts
During FY 2012 the Justice Department said the government obtained 1.8 of these prosecutions for every one million people in the United States, compared with 2.2 prosecutions for one million people in the United States during FY 2013.
Understandably, there is great variation in the per capita number of prosecutions in each of the nation's ninety-four federal judicial districts; Table 3 lists the ten districts with the greatest per capita count of criminal prosecutions referred by the Social Security Administration in FY 2013.
| Judicial District | Percapita | Count | Rank | 1yr ago | 5yrs ago | 10yrs ago | 20yrs ago |
|---|---|---|---|---|---|---|---|
| Mo, E | 15 | 44 | 1 | 2 | 2 | 3 | 32 |
| Ken, E | 11 | 23 | 2 | 3 | 46 | 15 | - |
| Ark, E | 10 | 17 | 3 | 7 | 15 | 68 | 20 |
| Ark, W | 8 | 11 | 4 | 28 | 77 | 61 | - |
| Montana | 8 | 8 | 5 | 1 | 4 | 8 | 13 |
| Ala, S | 6 | 5 | 6 | 4 | 13 | 12 | 32 |
| Iowa, S | 6 | 10 | 7 | 18 | 50 | 14 | 32 |
| Oregon | 6 | 22 | 8 | 10 | 27 | 11 | 9 |
| Virg, W | 6 | 12 | 9 | 37 | 20 | 56 | - |
| W Virg, N | 5 | 5 | 10 | 57 | 77 | 53 | - |
The Eastern District of Missouri (St. Louis) — with 15.09 prosecutions as compared with 2.2 prosecutions per one million people in the United States — was the most active through September 2013. The Eastern District of Missouri (St. Louis) was ranked second a year ago as well as five years ago. The district's position ten years ago was third, but only 32nd twenty years ago.
The Eastern District of Kentucky (Lexington) ranked second. The Eastern District of Kentucky (Lexington) was ranked third a year ago; the district's position ten years ago was 15th.
The Eastern District of Arkansas (Little Rock) now ranks third. The Eastern District of Arkansas (Little Rock) was ranked seventh a year ago. The district's position ten years ago was 68th, and 20th twenty years ago.
Ten years ago, the following districts which are currently ranked did not appear in the top ten: Oregon, Southern District of Alabama (Mobile), Southern District of Iowa (Des Moines), Eastern District of Kentucky (Lexington), Northern District of West Virginia (Wheeling), Western District of Virginia (Roanoke), Western District of Arkansas (Fort Smith) and Eastern District of Arkansas (Little Rock).
And compared to 20 years ago, Montana, Eastern District of Arkansas (Little Rock), Eastern District of Missouri (St. Louis), Southern District of Alabama (Mobile) and Southern District of Iowa (Des Moines) were not sufficiently active to then make the top 10.
The federal judicial district which showed the greatest growth in the rate of prosecutions compared to one year ago — 400 percent — was the Northern District of West Virginia (Wheeling). Compared to five years ago, the district with the largest growth — 660 percent — was the Eastern District of Kentucky (Lexington).
In the last year, the District Court recording the largest drop in the rate of prosecutions — 38.4 percent — was Montana.