Equal Justice and Sentencing Practices Among Federal District Court Judges
The changed makeup of the U.S. Supreme Court and the influence of recent appointments on the outcome of cases the Court hears has been the focus of a great deal of recent public attention. It should not be surprising that the identity of a judge can impact decision outcome. This phenomenon is not limited to the Supreme Court. It applies to judges on courts at all levels. Countless studies over the years have documented a basic fact: while decisions should be determined by the law and the facts, in reality there is a third very important force at work. This ingredient is the identity of the judge assigned to a given case.
This report examines very recent data on federal trial judges and their sentencing practices. The existence of judge-to-judge differences in sentences of course is not synonymous with finding unwarranted sentencing disparity. Most people agree that a key requirement for achieving justice in this country is that the judges in a court system have sufficient discretion to consider the totality of circumstances in deciding that a sentence in a specific case is just. No set of rules, including the Federal Sentencing Guidelines[1], can substitute for this necessary individualized judgment.
But a fair court system always seeks to provide equal justice under the law, working to ensure that sentencing patterns of judges not be widely different when they are handling similar kinds of cases.
In reality, sometimes the goal of equal justice under the law is achieved, and other times the actual sentences handed down depart markedly from this goal. Using case-by- case, judge-by-judge, data updated through December 2020,[2] a new analysis by the Transactional Records Access Clearinghouse (TRAC) at Syracuse University identifies federal courthouses where wide judge-to-judge sentencing differences currently occur, and courthouses where there is wide agreement in sentencing among judges.
While special circumstances might account for some of these differences, half of the courthouses in the country had median differences in prison sentences of 16 months or more, and average differences of 21 months or more.
Results further showed that currently seven (7) federal courthouses out of 159 compared had perfect agreement among judges in the typical or median sentences assigned. In an additional thirty (30), judge-to-judge sentences differed by six months or less. The seven courthouses with perfect agreement included those at; Lincoln, Nebraska; Providence, Rhode Island; Albany, Georgia; Ft. Myers, Florida; Las Cruces, New Mexico; and El Paso and Del Rio, Texas.
At the other extreme, five (5) courthouses showed more than 60 months difference in the median prison sentence handed out across judges serving on the same bench. These five courthouses with extreme differences were: Tampa, Florida; Benton, Illinois; Orlando, Florida; Greenbelt, Maryland; and Philadelphia, Pennsylvania. The remaining courthouses were arrayed between these two extremes as shown in Figure 1 and Table 1.
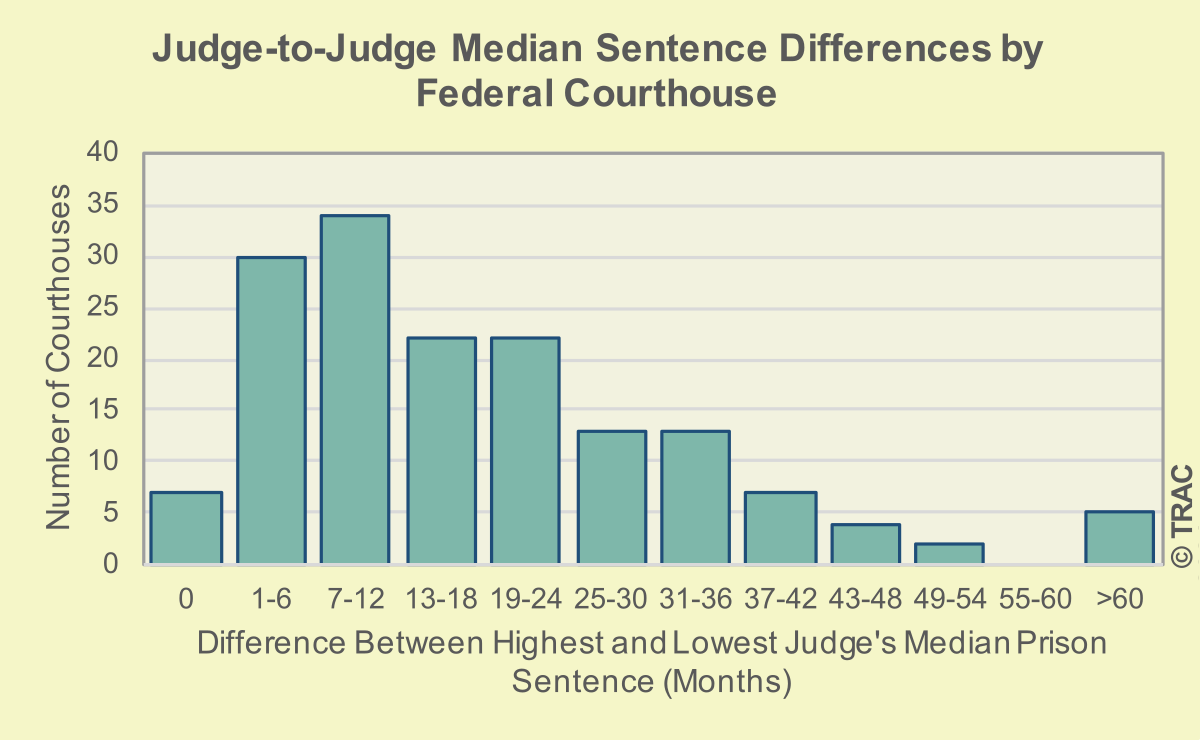
| Difference Between Judge with Highest and Lowest Median Sentence | Number of Courthouses |
| 0 months | 7 |
| 1-6 months | 30 |
| 7-12 months | 34 |
| 13-18 months | 22 |
| 19-24 months | 22 |
| 25-30 months | 13 |
| 31-36 months | 13 |
| 37-42 months | 7 |
| 43-48 months | 4 |
| 49-54 months | 2 |
| 55-60 months | 0 |
| >60 months | 5 |
| Total Courthouses Compared | 159 |
TRAC's Study and Random Assignment
It would be inappropriate to compare sentences handed down by judges sitting in different courthouses. Case characteristics vary widely among communities in the country. This means that just because two judges hand down typical sentences of different lengths, it is plausible that these differences simply reflect actual differences in the nature, statutory penalties, and seriousness of the crimes in each judge's caseload rather than real differences in their sentencing philosophies. Even comparisons which focus on sentencing practices for particular classes of offenses, such as drugs or white-collar crimes, still are potentially left with substantial variation in the nature and seriousness of the makeup of offenses within each of these broad categories.
Instead, TRAC compares judges within the same courthouse. This approach takes advantage of the broad institutional promise that criminal cases within the same courthouse are assigned to judges on a random basis[3]. When random assignment occurs, we know by the law of large numbers that—assuming a reasonably large number of cases—the composition of the cases each judge hears will be roughly comparable. Just as this methodology based upon random assignment to different groups is the gold standard for determining whether a new vaccine or the adoption of new medical procedures have any real impact on patient outcomes, in a similar fashion this methodology provides the most reliable method for isolating the influence of a particular judge's sentencing practices from the impact of the multitude of other factors impacting sentence outcome, including the nature and seriousness of the crime and the defendant's personal history[4].
To ensure a sufficient number of cases, we limited our analysis to federal district court judges who sentenced at least 50 defendants at a given courthouse. A total of 159 courthouses had at least two judges who had a sufficient volume of cases to compare. From January 2016 through December 2020, 873 federal district court judges met this standard. Together, they sentenced a total of 301,326 defendants. The median prison sentence in months for each judge was calculated and then compared with that for the remaining judges serving on the bench at the same courthouse.
The median sentence was used for comparison since it represents a typical sentence for that judge with half of defendants given a longer sentence and half shorter terms. Unlike the average sentence, the median sentence is not influenced at all by extremely long sentences that could occur in unusual cases.
Individual reports by name on each judge[5] have just been published and are available at TRAC's Judge Information Center. Each report compares that judge's prison sentences to each other judge at that courthouse, and provides details on the composition of each judge's caseload as compared with others to see if they were in fact comparable.
Twelve Big City Courthouses and Their Sentencing Patterns
Courthouses with just two judges sometimes had larger sentencing differences than courthouses with many more judges. However, one might expect more dispersion in judge sentencing practices in courthouses with a larger number of judges.
Accordingly, we turn to sentencing patterns in twelve of the largest courthouses located in major metropolitan centers. These ranged in size from 10 judges at federal courthouses in Atlanta and San Francisco to 33 judges in Manhattan. Together the 204 judges on these U.S. District Courts sentenced a total of 45,823 defendants or an average of 225 defendants each.
Judge-to-judge differences in the median prison sentence given ranged from a low of 16 months in Miami, Florida to a high of 64 months in Philadelphia, Pennsylvania. This was computed by comparing the judge with the lowest median sentence to that of the judge with the highest median sentence. See Table 2. Also given is the sentence assigned by the "middle" judge—that is half of judges had higher median sentences at that courthouse, half lower.
| Federal Judicial District | Courthouse | Number of Judges | Judge with Median Sentence that was: | |||
| Lowest | Median | Highest | Range | |||
| Penn, E | Philadelphia | 23 | 0.0 | 30.00 | 64.0 | 64.0 |
| N. Y., S | Manhattan | 33 | 0.0 | 24.00 | 45.0 | 45.0 |
| Mich, E | Detroit | 18 | 2.9 | 24.50 | 39.0 | 36.1 |
| N. Y., E | Brooklyn | 19 | 0.0 | 14.00 | 33.0 | 33.0 |
| Cal, C | Los Angeles | 17 | 15.0 | 24.00 | 46.0 | 31.0 |
| Texas, S | Houston | 12 | 12.0 | 21.50 | 42.0 | 30.0 |
| Ill, N | Chicago | 22 | 24.0 | 33.30 | 52.5 | 28.5 |
| Mass | Boston | 12 | 12.0 | 19.00 | 37.0 | 25.0 |
| Ga, N | Atlanta | 10 | 21.0 | 32.00 | 46.0 | 25.0 |
| Cal, N | San Francisco | 10 | 18.0 | 24.00 | 41.5 | 23.5 |
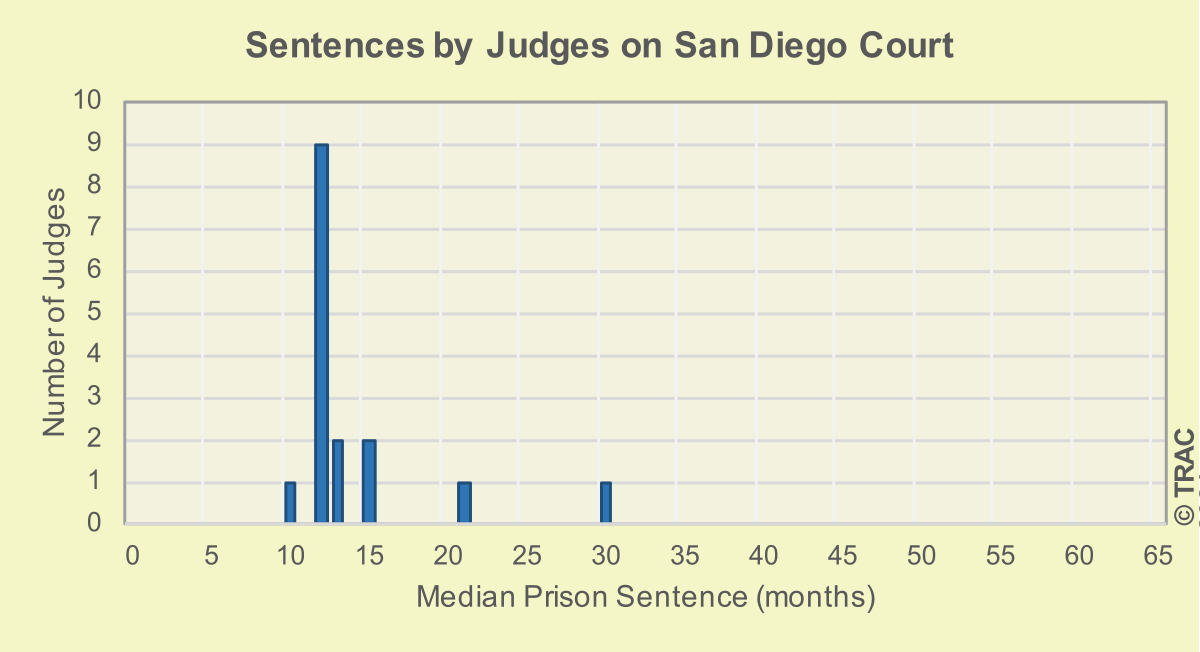
| Cal, S | San Diego | 16 | 10.0 | 12.00 | 30.0 | 20.0 |
| Fla, S | Miami | 12 | 21.0 | 27.30 | 37.0 | 16.0 |
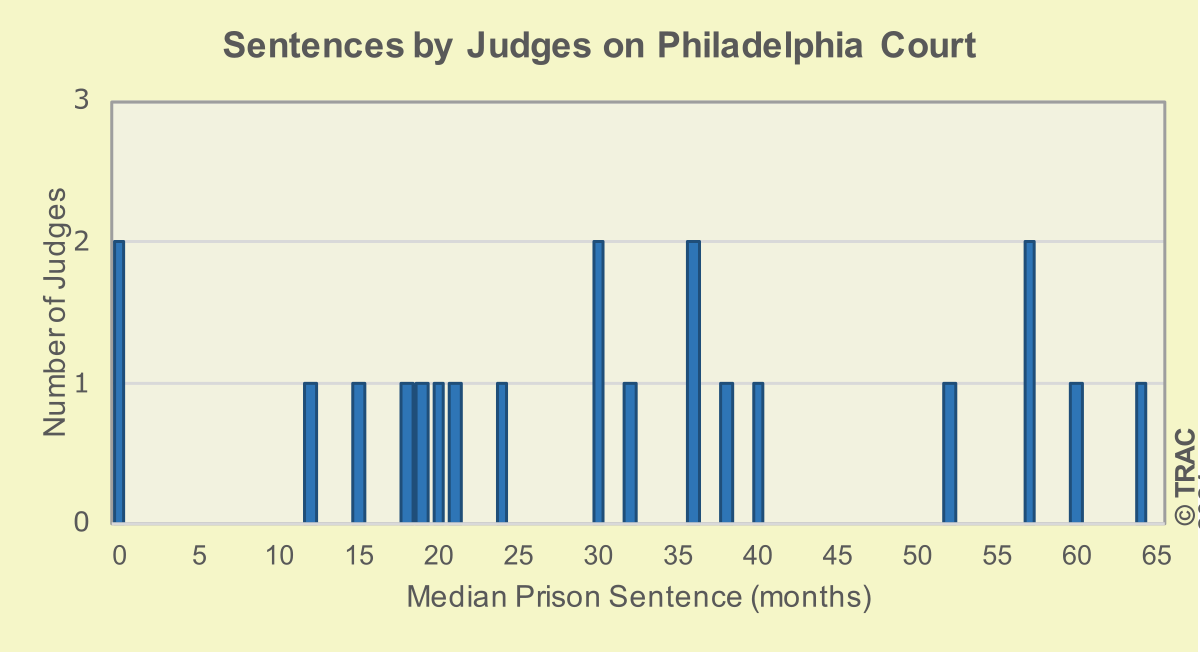
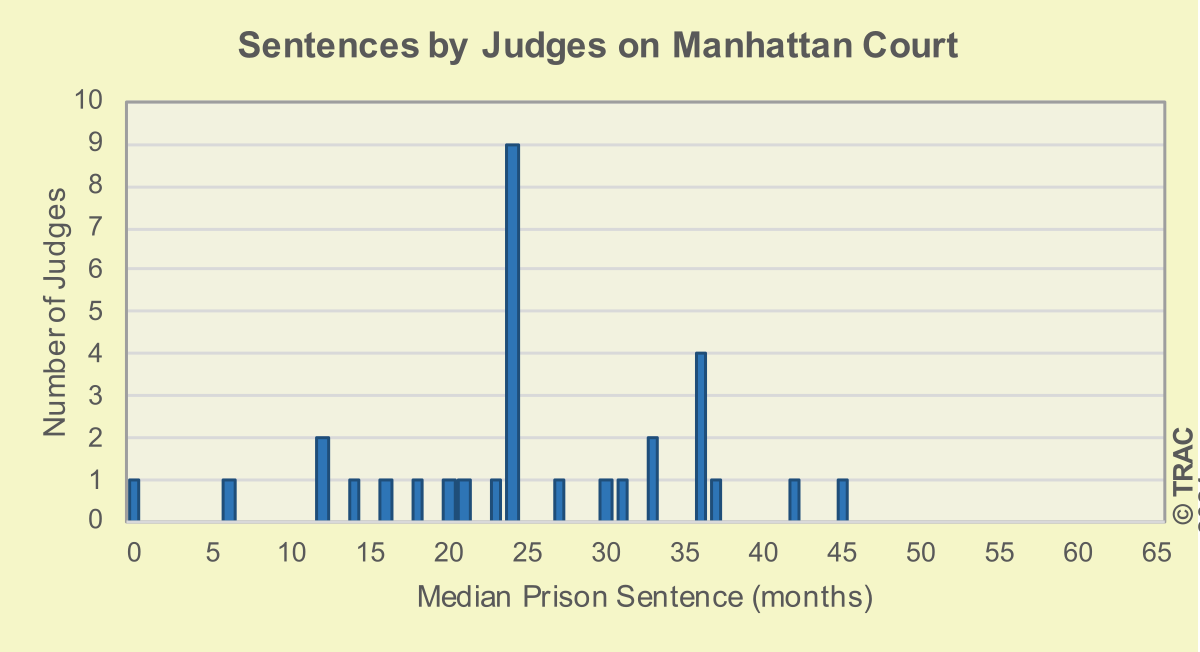
Focusing on the two courts with the highest difference, Figure 2 displays the individual judge-by-judge median sentences given by each of the 23 judges in Philadelphia, and Figure 3 displays those for each of the 33 judges in Manhattan. In neither case are differences due to an unusual outlier among judges, but generally reflect general dispersion of sentencing patterns among judges along the entire range. Greater dispersion is shown for Philadelphia as compared with Manhattan reflecting the wider range of differences among judges. While the goal of systematically examining sentences is not to develop a lockstep sentencing system, the extent of dispersion is notable
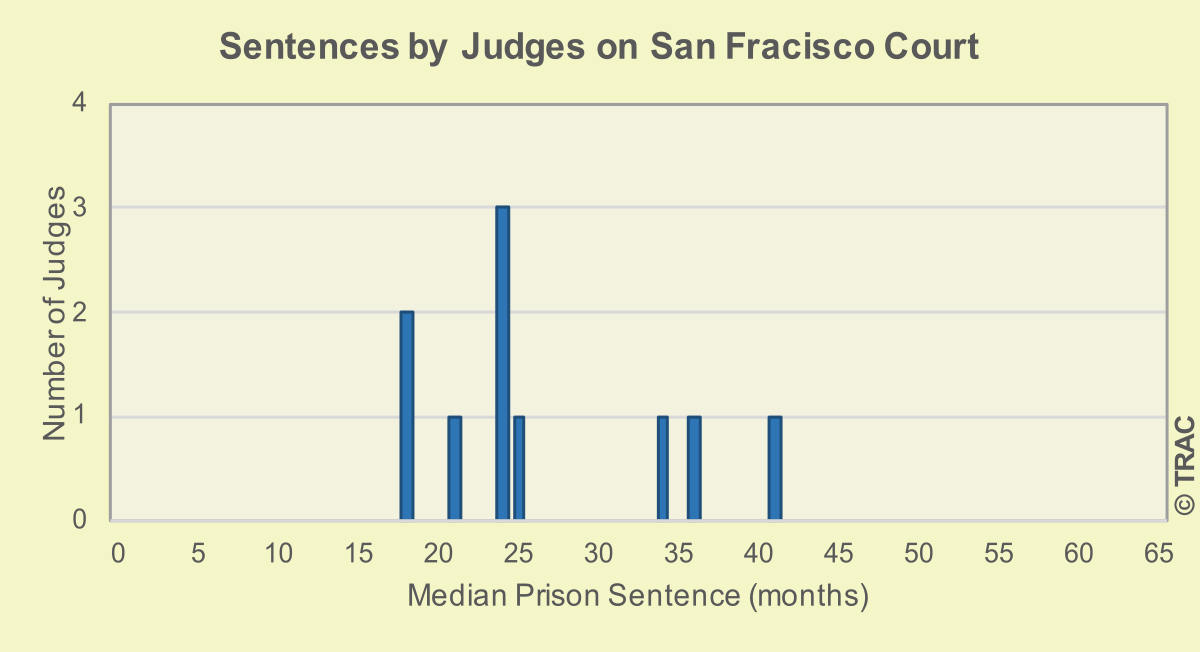
A somewhat different pattern is found in San Francisco (Figure 4) and San Diego (Figure 5). Both courts show lower levels of dispersion than in Philadelphia and Manhattan. For San Diego, we also see more clustering, with only two judges giving higher typical sentences.
(Click for larger image)
(Click for larger image)
(Click for larger image)
(Click for larger image)
Conclusion
This study largely replicates the findings from TRAC's first national judge-by-judge examination of the differences among federal judges in sentencing practices that appeared in the Federal Sentencing Reporter. That study was published almost a decade ago. While it is true that some specific courthouses show greater agreement today, others show less agreement. Many of these changes appear to reflect changes in the judges currently serving there.
Yet answering the question of whether significant intra-judge differences in sentencing practices exist is not sufficient to establish that such differences are indeed unwarranted sentencing disparities. Much more research and a great deal more time is needed for a thorough examination of the actual details of judge-by-judge sentencing patterns.
TRAC has developed and is making available extensive updated sentencing data through our TRAC Fellows program to other scholars[6]. It is our hope that more researchers will take up this challenge to empirically examining what gives rise to differences, as well as changes in sentencing patterns over time at a courthouse.
Research also needs the informed insights of those who know first-hand the inner workings of our federal trial courts—judges, prosecutors, defense attorneys, and others intimately involved in the work of delivering justice on a day-to-day basis. To assist in this dialogue, as mentioned above, TRAC has compiled individual reports on each of the 873 U.S. District Court judges covered in this study, available here[7].
Footnotes
[1] A system of "sentencing guidelines" for federal judges was established during the eighties in an attempt to reduce sentencing disparity. Originally mandatory, following a U.S. Supreme Court decision in 2005, they are now advisory. While judges must consider the guidelines, they are not required to follow them.
[2] For more information about this TRAC database and how we develop and update it each month, see The Development of Judge-Specific Federal Sentencing Data at TRAC.
[3] It is also important to keep in mind, that the actual assignment of cases to judges at the same courthouses may not always adhere to random assignment. Surprisingly little scholarly research assessing federal court assignment practices is available. For example, practices differ on the reliance upon senior judges who have officially retired but continue to take on some cases and may play more specialized roles. Other situations may occur where departures from random assignment occur. Therefore, it is always important to examine the specific composition of cases to see if the assumption of random assignment still holds where judge-to-judge differences are observed.
[4] This does not imply that judges are the only individuals who exert influence over sentence length. Federal prosecutors influence sentence outcome in many ways, including through plea negotiations and of course in the decision on the specific charges brought. Unless federal prosecutors can steer cases to specific judges, or the judge assigned to a case influences which federal prosecutor is assigned to litigate a matter, random assignment also controls for any potential independent effects of the federal prosecutor assigned on inter-judge differences in sentencing outcome.
[5] Use of TRAC's online free interactive query tools providing comparative details on the number of defendants each judge has sentenced are available here. These same tools provide access to individual reports on each U.S. District Court judge and are available for a charge or through an organizational site license to TRAC's information services. You can view a sample report here. TRAC is a small research data center established in 1989 at Syracuse University and is self-supporting. Fees charged for individual judge reports are used so that we can continue to add to our case-by-case judge sentencing data.
[6] Through the TRAC Fellows program, scholars can obtain access to case-by-case, judge-by-judge, data that TRAC has compiled along with technical support. The data goes back through October 2003 and is kept up-to-date on a monthly basis. Information about how to apply to become a TRAC Fellow is available here.
[7] See earlier footnote 5.
TRAC data on the workloads of federal judges are part of TRAC's Judge Information Center. TRAC compiles, verifies, and publishes information on the workloads of federal district court judges.
The free Criminal Caseload Tool provides information on criminal caseloads.
TRAC's free Civil Caseload Tool provides rankings for nearly every federal district court judge in the country — by the number of civil cases pending at the time of the last update and the number closed in the year prior to the last update. The Judge Information Center also provides information on Immigration Court judges.
In addition to the free caseload data, a subscription to the Center provides access to custom reports on each judge, showing in greater detail the composition of the judge's caseload, the time on average it takes to close cases, how those closing times compare to other judges in the district, and a detailed look at the cases the judge took the longest to close.
TRAC is a nonpartisan, nonprofit data research center affiliated with the Newhouse School of Public Communications and the Whitman School of Management, both at Syracuse University. For more information, to subscribe, or to donate, contact trac@syr.edu or call 315-443-3563.