Environment Prosecutions Decline Under Obama
Table 1. Federal Prosecution of
Environment-Related Crimes
Number Year-to-date 271 Percent Change from previous year -19.6 Percent Change from 5 years ago -26.5 Percent Change from 10 years ago -57.1 Percent Change from 20 years ago 164 The number of federal prosecutions for environment-related offenses continues to fall. The latest available data from the Justice Department show that during the first nine months of FY 2014, the government reported 271 new prosecutions in this category. If such prosecutions continue at the current rate, there will be a total of 361 environment prosecutions for the full year. This would represent a decrease of 19.6 percent from the 449 reported in FY 2013, which was already a marked drop from the 612 defendants prosecuted in FY 2012.
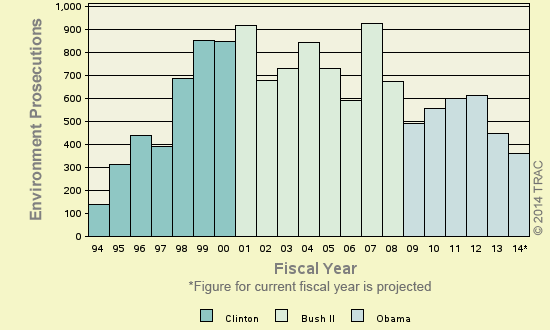
The result of this two-year decline would be a projected total for FY 2014 that falls well under half of the 927 environment crime prosecutions in FY 2007, a peak that occurred near the end President George W. Bush's second term.
Comparisons of the number of defendants charged with environment-related offenses are based on case-by-case information obtained by the Transactional Records Access Clearinghouse (TRAC) at Syracuse University from the Executive Office for United States Attorneys (EOUSA) under the Freedom of Information Act (see Table 1).
The long term trend in environment prosecutions going back to FY 1994 is shown more clearly in Figure 1. The vertical bars in Figure 1 represent the number of environment prosecutions recorded each fiscal year (for the current fiscal year, projected figures are shown). Each presidential administration is distinguished by the color of the bars. For the latest data and to view trends month-by-month rather than year-by-year, see TRAC's monthly report series.
Leading Program Categories
The sharpest drop for the period was seen in those prosecutions aimed at protecting wildlife, down by 36.7 percent from five years ago. Less affected were prosecutions aimed at environment crimes such as water and air pollution and hazardous waste management, which fell by 8.6 percent.
Despite these decreases, the single largest number of environment-related prosecutions through June 2014 was still for wildlife protection, accounting for 49.4 percent of such matters. As shown in Figure 2, the second largest number of prosecutions were filed under the program area of "Environmental Crimes" (47.2%). The "Other" category in Figure 2 is comprised of a diverse group of programs, the largest of which was that involving "Marine Resources" (3.3%).
Leading Investigative Agencies
The lead investigative agency for environment prosecutions through June 2014 was the Department of the Interior, accounting for 49.8 percent of prosecutions referred.
As shown in Figure 3, additional agencies with substantial numbers of environment referrals were: the Environmental Protection Agency (25.8%), the Department of Agriculture (7%), the Department of Commerce (4.4%) and the Federal Bureau of Investigation (4.4%). The "Other" category in Figure 3 is comprised of a diverse group of agencies; the largest number of referrals within this group came from the Department of Homeland Security (2.2%).
Figure 2. Specific Types of Prosecution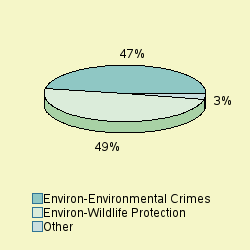
Figure 3. Prosecutions by Investigative Agency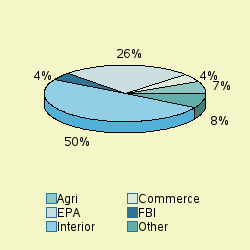
Top Ranked Lead Charges
Table 2 shows the top lead charges recorded in the prosecution of environment-related matters filed in U.S. District Court during the first nine months of FY 2014.
Note: There were an additional 48 other lead charges which were not individually ranked. Use TRACFed's criminal analyzer tool to generate a complete listing for any year (subscription required).
Table 2. Top Charges Filed
Lead Charge Count Rank 1 yr ago 5 yrs ago 10 yrs ago 20 yrs ago 16 USC 3372 - Illegally Taken Fish & Wildlife - prohibited acts 48 1 1 2 2 21 16 USC 703 - Taking, killing, or possessing migratory birds 26 2 2 1 1 21 33 USC 1319 - Water Pollution - Enforcement 23 3 3 3 4 2 18 USC 371 - Conspiracy to commit offense or to defraud US 21 4 15 11 11 9 Other US Code Section 21 4 10 7 7 4 16 USC 1538 - Endangered Species - Prohibitive acts 19 6 5 5 7 15 16 USC 668 - Bald and golden eagles 13 7 8 4 3 - 16 USC 704 - When/how migratory birds may be taken, killed,poss 12 8 4 12 6 - 18 USC 545 - Smuggling goods into the United States 11 9 11 14 15 12 42 USC 7413 - Air Pollution Prevention and Control - Fed strd 11 9 6 7 13 5 Federal Regulation 11 9 7 14 17 21
"Illegally Taken Fish & Wildlife - prohibited acts" (Title 16 U.S.C Section 3372) was the most frequently recorded lead charge. Title 16 U.S.C Section 3372 was ranked first a year ago, while it was the second most frequently invoked five years ago. It was ranked second ten years ago and twenty-first twenty years ago.
Ranked second in frequency was the lead charge "Taking, killing, or possessing migratory birds" under Title 16 U.S.C Section 703. Title 16 U.S.C Section 703 was ranked second a year ago, while it was the first most frequently invoked five years ago. It was ranked first ten years ago and twenty-first twenty years ago.
Ranked third was "Water Pollution - Enforcement" under Title 33 U.S.C Section 1319. Title 33 U.S.C Section 1319 was ranked third a year ago, while it was the third most frequently invoked five years ago. It was ranked fourth ten years ago and second twenty years ago.
Among these top ten lead charges, the one showing the greatest projected increase in prosecutions — up 367 percent — compared to one year ago was Title 18 U.S.C Section 371 involving "Conspiracy to commit offense or to defraud US". This was the same statute that had the largest projected increase — 115 percent — when compared with five years ago.
Again among the top ten lead charges, the one showing the sharpest projected decline in prosecutions compared to one year ago — down 46.7 percent — was "When/how migratory birds may be taken, killed,poss" (Title 16 U.S.C Section 704). This was the same statute that had the largest projected decrease — 70.4 percent — when compared with five years ago.
Table 3. Top Districts
Judicial District Count Rank Cal, C 19 1 Fla, S 19 1 S Dakota 19 1 La, E 17 4 Alaska 10 5 La, W 10 5 Miss, N 10 5 Cal, S 8 8 Wash, W 8 8 Hawaii 7 10 Top Ranked Judicial Districts
Understandably, there is great variation in the number of environment prosecutions in each of the nation's ninety-four federal judicial districts. The districts registering the largest number of prosecutions of this type during the first nine months of FY 2014 are shown in Table 3.
The Central District of California (Los Angeles), Southern District of Florida (Miami) and District of South Dakota — each with 19 prosecutions — were the most active through June 2014.
Report Date: September 17, 2014