Government Regulatory Prosecutions Fall to Record Low
Criminal Prosecutions
| Number Latest Month | 76 |
|---|---|
| Percent Change from previous month | -57.1 |
| Percent Change from 1 year ago | -16.9 |
| Percent Change from 5 years ago (Including Magistrate Court) |
-30.5 |
| Percent Change from 5 years ago (Excluding Magistrate Court) |
-54.4 |
The latest available data from the Justice Department show that during April 2016 the government reported 76 new government regulatory prosecutions, the lowest count in this program category for a single month since October 1998, the start of TRAC's monthly time series. According to the case-by-case information analyzed by the Transactional Records Access Clearinghouse (TRAC), this number is down 57.1 percent over the previous month.
The comparisons of the number of defendants charged with government regulatory-related offenses are based on case-by-case information obtained by TRAC under the Freedom of Information Act from the Executive Office for United States Attorneys (see Table 1).
When monthly 2016 prosecutions of this type are compared with those of the same period in the previous year, the number of filings was down 16.9 percent. Prosecutions over the past year are still much lower than they were five years ago. Overall, the data show that prosecutions of this type are down 30.5 percent from levels reported in 2011.
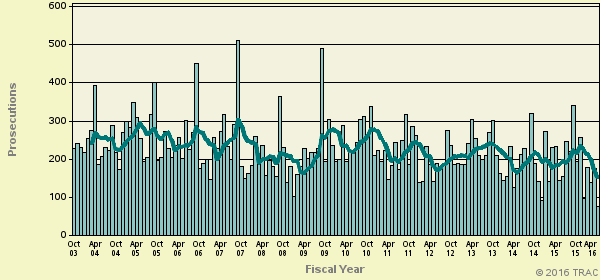
Figure 1. Monthly Trends in Government Regulatory Prosecutions
The decrease from the levels five years ago in government regulatory prosecutions is shown more clearly in Figure 1. The vertical bars in Figure 1 represent the number of government regulatory prosecutions of this type recorded on a month-to-month basis. Where a prosecution was initially filed in U.S. Magistrate Court and then transferred to the U.S. District Court, the magistrate filing date was used since this provides an earlier indicator of actual trends. The superimposed line on the bars plots the six-month moving average so that natural fluctuations are smoothed out. The one and five-year rates of change in Table 1 and in the sections that follow are all based upon this six-month moving average.
Within the broad category of government regulatory, cases were classified by prosecutors into more specific types.
Case types within government regulatory are
- Counterfeiting and Forgery
- Customs Violations - Duty
- Customs Violations - Currency
- Energy Pricing and Related Fraud
- Health and Safety Violations - Employees
- Health and Safety Violations - General Public
- Copyright Violations
- Trafficking in Contraband Cigarettes
- Energy Violations - Nuclear Waste Issues
- Money Laundering/Structuring (Narcotics)
- Money Laundering/Structuring (Other)
- Export Enforcement General
- Other Government Regulatory Offenses
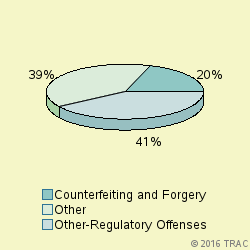
The largest number of prosecutions of these matters in April 2016 was for "Other-Regulatory Offenses", accounting for 40.8 percent of prosecutions. Prosecutions were also filed for "Counterfeiting and Forgery" (19.7%), "Money Laundering-Drug" (13.2%), "Money Laundering-Other" (13.2%), "Customs-Currency Violations" (10.5%). See Figure 2.
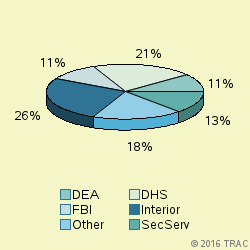
The lead investigative agency for government regulatory prosecutions in April 2016 was Interior accounting for 26 percent of prosecutions referred. Other agencies with substantial numbers of government regulatory referrals were: DHS (21% ), SecServ (13%), DEA (11%), FBI (11%). See Figure 3.
Government Regulatory Prosecutions in U.S. Magistrate Courts
Top Ranked Lead Charges
In April 2016, 37 defendants in government regulatory cases for these matters were filed in U.S. Magistrate Courts. These courts handle less serious misdemeanor cases, including what are called "petty offenses." In addition, complaints are sometimes filed in the magistrate courts before an indictment or information is entered. In these cases, the matter starts in the magistrate courts and later moves to the district court where subsequent proceedings take place.
In the magistrate courts in April the most frequently cited lead charge was Title 36 CFR 4.21c involving "Speeding". This was the lead charge for 18.9 percent of all magistrate filings in April.
Other frequently prosecuted lead charges include: "18 USC 371 - Conspiracy to commit offense or to defraud US" (13.5%), "36 CFR 2.35b2 - Possession of a controlled substance" (13.5%).
Government Regulatory Prosecutions in U.S. District Courts
In April 2016, 39 defendants in new cases for these matters were charged in the U.S. District Courts. In addition during April there were an additional 6 defendants whose cases moved from the magistrate courts to the U.S. district courts after an indictment or information was filed. The sections which follow cover both sets of cases and therefore cover all matters filed in district court during April.
Top Ranked Lead Charges
Table 2 shows the top lead charges recorded in the prosecutions of government regulatory matters filed in U.S. District Court during April 2016.
| Lead Charge | Count | Rank |
|---|---|---|
| 18 USC 1956 - Laundering of monetary instruments | 13 | 1 |
| 18 USC 371 - Conspiracy to commit offense or to defraud US | 3 | 2 |
| 18 USC 472 - Uttering counterfeit obligations or securities | 3 | 2 |
| 18 USC 1001 - Fraud/false statements or entries generally | 3 | 2 |
| 18 USC 1029 - Fraud and related activity - access devices | 3 | 2 |
| 18 USC 2320 - Trafficking in counterfeit goods or services | 3 | 2 |
| 31 USC 5324 - Structuring transactions to evade reporting requir | 3 | 2 |
| 21 USC 841 - Drug Abuse Prevention & Control-Prohibited acts A | 2 | 8 |
| 16 USC 551 - Protection of national forests; rules and regs | 1 | 10 |
| 18 USC 471 - Obligations or securities of United States | 1 | 10 |
| 18 USC 1028 - Fraud and related activity - id documents | 1 | 10 |
| 18 USC 1349 - Mail Fraud - Attempt and Conspiracy | 1 | 10 |
| 18 USC 1503 - Influencing or injuring officer or juror generally | 1 | 10 |
| 18 USC 1546 - Fraud and misuse of visas, permits, and other documents | 1 | 10 |
| 18 USC 1960 - Prohibition of illegal money transmitting business | 1 | 10 |
| 31 USC 5332 - Bulk Cash Smuggling into or out of the United States | 1 | 10 |
| 42 USC 1320d-6 - Wrongful disclosure of individually identifiable health information | 1 | 10 |
| 49 USC 46314 - Entering aircraft or airport area in violation of security | 1 | 10 |
"Laundering of monetary instruments" (Title 18 U.S.C. Section 1956) was the most frequently recorded lead charge.
Ranked 2nd in frequency were the lead charges "Conspiracy to commit offense or to defraud US" under Title 18 U.S.C. Section 371, "Uttering counterfeit obligations or securities" under Title 18 U.S.C. Section 472, "Fraud/false statements or entries generally" under Title 18 U.S.C. Section 1001, "Fraud and related activity - access devices" under Title 18 U.S.C. Section 1029, "Trafficking in counterfeit goods or services" under Title 18 U.S.C. Section 2320 and "Structuring transactions to evade reporting requir" under Title 31 U.S.C. Section 5324.
Top Ranked Judicial Districts
(per One Million People)
| Judicial District | Count | Rank |
|---|---|---|
| Texas, S | 9 | 1 |
| Fla, S | 5 | 2 |
| Cal, C | 3 | 3 |
| S Car | 3 | 3 |
| Cal, E | 2 | 5 |
| Cal, S | 2 | 5 |
| Penn, W | 2 | 5 |
| Alaska | 1 | 8 |
| Arizona | 1 | 8 |
| Colorado | 1 | 8 |
| Conn | 1 | 8 |
| Fla, M | 1 | 8 |
| Hawaii | 1 | 8 |
| Idaho | 1 | 8 |
| Ill, N | 1 | 8 |
| Mo, W | 1 | 8 |
| N. Y., E | 1 | 8 |
| N. Y., W | 1 | 8 |
| Nebraska | 1 | 8 |
| Okla, E | 1 | 8 |
| Penn, E | 1 | 8 |
| Puer Rico | 1 | 8 |
| Texas, N | 1 | 8 |
| Vermont | 1 | 8 |
| W Virg, S | 1 | 8 |
| Wisc, W | 1 | 8 |
In April 2016 the Justice Department said the government brought 16.9 government regulatory prosecutions for every ten million people in the United States.
Understandably, there is great variation in the number of government regulatory prosecutions that are filed in each of the nation's ninety-four federal judicial districts.
The districts registering the largest number of prosecutions of this type last month are shown in Table 3. (Because of ties, there are a total of 26 districts listed in what might otherwise be called the "top ten" rankings.)
The Southern District of Texas (Houston) — with 9 prosecutions — was the most active during April 2016.
The Southern District of Florida (Miami) ranked 2nd.
Central District of California (Los Angeles) and District of South Carolina are now ranking 3rd.
Top Ranked District Judges
| Judge | Count | Rank | |
|---|---|---|---|
| Alvarez, Micaela | Texas, S | 7 | 1 |
| Wright, Otis D., II | Cal, C | 2 | 2 |
| Burrell, Garland Ellis, Jr. | Cal, E | 2 | 2 |
| Lenard, Joan A. | Fla, S | 2 | 2 |
| McVerry, Terrence F. | Penn, W | 2 | 2 |
| Burgess, Timothy Mark | Alaska | 1 | 6 |
| Marquez, Rosemary | Arizona | 1 | 6 |
| Benitez, Roger T. | Cal, S | 1 | 6 |
| Bashant, Cynthia Ann | Cal, S | 1 | 6 |
| Jackson, Richard Brooke | Colorado | 1 | 6 |
| Chatigny, Robert N. | Conn | 1 | 6 |
| Steele, John E. | Fla, M | 1 | 6 |
| Middlebrooks, Donald M. | Fla, S | 1 | 6 |
| Marra, Kenneth A. | Fla, S | 1 | 6 |
| Gayles, Darrin Phillip | Fla, S | 1 | 6 |
| Kobayashi, Leslie Emi | Hawaii | 1 | 6 |
| Bush, Ronald E. | Idaho | 1 | 6 |
| Shah, Manish Suresh | Ill, N | 1 | 6 |
| Harpool, M. Douglas | Mo, W | 1 | 6 |
| Chen, Pamela Ki Mai | N. Y., E | 1 | 6 |
| Arcara, Richard Joseph | N. Y., W | 1 | 6 |
| Gossett, F.A. | Nebraska | 1 | 6 |
| White, Ronald A. | Okla, E | 1 | 6 |
| Schiller, Berle M. | Penn, E | 1 | 6 |
| Besosa, Francisco Augusto | Puer Rico | 1 | 6 |
| Fitzwater, Sidney Allen | Texas, N | 1 | 6 |
| Head, Hayden Wilson, Jr. | Texas, S | 1 | 6 |
| Miller, Gray Hampton | Texas, S | 1 | 6 |
At any one time, there are about 680 federal District Court judges working in the United States. The judges recorded with the largest number of new government regulatory crime cases of this type during April 2016 are shown in Table 4.
All 28 of the top judges were in districts which were in the top ten in terms of having the largest number of government regulatory filings. (Because of ties, there are a total of 28 judges in what might otherwise be called the "top ten" rankings.)
Judge Micaela Alvarez in the Southern District of Texas (Houston) ranked 1st with 7 defendants in government regulatory cases.
Judges Otis D. Wright, II in the Central District of California (Los Angeles), Garland Ellis Burrell, Jr. in the Eastern District of California (Sacramento), Joan A. Lenard in the Southern District of Florida (Miami) and Terrence F. McVerry in the Western District of Pennsylvania (Pittsburgh) ranked 2nd with 2 defendants in government regulatory cases.
TRAC offers free monthly reports on program categories such as white collar crime, immigration, drugs, weapons and terrorism and on selected government agencies such as the IRS, FBI, ATF and DHS. For the latest information on prosecutions and convictions, go to http://trac.syr.edu/tracreports/bulletins/. In addition, subscribers to the TRACFed data service can generate custom reports for a specific agency, judicial district, program category, lead charge or judge via the TRAC Data Interpreter.