Health Care Fraud Prosecutions Down 23 Percent
| Number Year-to-date | 239 |
|---|---|
| Percent Change from previous year | -23.2 |
| Percent Change from 5 years ago | -61.3 |
| Percent Change from 10 years ago | -9.5 |
Fiscal year 2016 is on pace to have the lowest level of federal prosecutions for health care fraud since FY 1998. The latest available data from the Justice Department show that during the first six months of FY 2016 the government reported 239 new health care fraud prosecutions. If this activity continues at the same pace, the annual total of prosecutions will be 478 for this fiscal year. According to the case-by-case information analyzed by the Transactional Records Access Clearinghouse (TRAC), this estimate is down 23.2 percent from the past fiscal year when the number of prosecutions totaled 622.
The comparisons of the number of defendants charged with health care fraud offenses are based on case-by-case information obtained by TRAC under the Freedom of Information Act from the Executive Office for United States Attorneys (see Table 1).
Compared to five years ago when there were 1,235, the estimate of FY 2016 prosecutions of this type is down 61.3 percent. Prosecutions over the past year are lower than they were ten years ago. Overall, the data show that prosecutions of this type are down 9.5 percent from the level of 528 reported in 2006.
The long term trend in health care fraud prosecutions going back to FY 1996 is shown more clearly in Figure 1. The vertical bars in Figure 1 represent the number of health care fraud prosecutions recorded each fiscal year. Projected figures for the current fiscal year are shown. Each presidential administration is distinguished by the color of the bars.
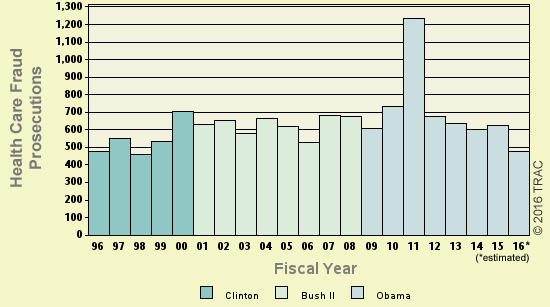
Figure 1. Criminal Health Care Fraud Prosecutions over the Last Twenty Years
Leading Investigative Agencies
Health and Human Services was the lead investigative agency for roughly half (49.4%) of the prosecutions so far this fiscal year.
The Federal Bureau of Investigation was recorded as the lead investigative agency for just under a third (31.8%). The Defense Department and the Drug Enforcement Agency accounted for 3.3 percent and 2.5 percent respectively.
Top Ranked Lead Charges
Table 2 shows the top lead charges recorded in the prosecutions of health care fraud matters filed in U.S. District Court during the first six months of FY 2016.
| Lead Charge | Count | Rank | 1 yr ago | 5 yrs ago | 10 yrs ago | 20 yrs ago |
|---|---|---|---|---|---|---|
| 18 USC 1347 - Health Care Fraud | 122 | 1 | 1 | 2 | 1 | - |
| 18 USC 1349 - Mail Fraud - Attempt and Conspiracy | 24 | 2 | 2 | 1 | 6 | - |
| 18 USC 1035 - False claims relating to health care matters | 13 | 3 | 6 | 11 | 4 | - |
| 42 USC 1320a-7 - Exclusion of certain individuals and entities from participation in Medicare and State health care programs | 13 | 3 | 4 | 9 | 38 | - |
| 18 USC 371 - Conspiracy to commit offense or to defraud US | 11 | 5 | 4 | 8 | 2 | 3 |
| 21 USC 841 - Drug Abuse Prevention & Control-Prohibited acts A | 10 | 6 | 14 | 16 | 13 | 23 |
| 21 USC 331 - Fed Food, Drug & Cosmetics Act - Prohibited acts | 8 | 7 | 3 | 10 | 3 | 12 |
| 18 USC 1341 - Mail Fraud - Frauds and swindles | 6 | 8 | 12 | 3 | 5 | 1 |
| 18 USC 1028A - Aggravated Identity Theft | 5 | 9 | - | - | - | - |
| Other US Code Section | 5 | 9 | 13 | 14 | 22 | 13 |
"Health Care Fraud" (Title 18 U.S.C. Section 1347) was the most frequent recorded lead charge. Title 18 U.S.C. Section 1347 was ranked first a year ago, while it was the second most frequently invoked five years ago. It was ranked first ten years ago.
Ranked second in frequency was the lead charge "Mail Fraud - Attempt and Conspiracy" under Title 18 U.S.C. Section 1349. Title 18 U.S.C. Section 1349 was ranked second a year ago, while it was the first most frequently invoked five years ago. It was ranked sixth ten years ago.
Ranked third were "False claims relating to health care matters" under Title 18 U.S.C. Section 1035 and "7 - Exclusion of certain individuals and entities from participation in Medicare and State health care programs" under Title 42 U.S.C. Section 1320a-7. Title 18 U.S.C. Section 1035 was ranked sixth a year ago. It was ranked fourth ten years ago. Title 42 U.S.C. Section 1320a-7 was ranked fourth a year ago, while it was the ninth most frequently invoked five years ago. It was ranked 38th ten years ago.
Among these top ten lead charges, the one showing the greatest projected increase in prosecutions — up 150 percent — compared to one year ago was Title 21 U.S.C. Section 841 that involves "Drug Abuse Prevention & Control-Prohibited acts A." This was the same statute that had the largest projected increase — 233 percent — when compared with five years ago.
Again among the top ten lead charges, the one showing the sharpest projected decline in prosecutions compared to one year ago — down 51.5 percent — was "Fed Food, Drug & Cosmetics Act - Prohibited acts" (Title 21 U.S.C. Section 331). This was the same statute that had the largest projected decrease — 94.4 percent — when compared with five years ago.
Top Ranked Judicial Districts
During FY 2015 the Justice Department said the government obtained 2 health care fraud prosecutions for every one million people in the United States. If the pace during the first six months of FY 2016 continues at the same rate, there will be 1.5 health care fraud prosecutions per million people in the United States this year. Understandably, there is great variation in the per capita number of health care fraud prosecutions in each of the nation's ninety-four federal judicial districts. Table 3 lists the ten most active districts in per capita terms.
| Judicial District |
Percapita | Count | Rank | 1yr ago | 5yrs ago | 10yrs ago | 20yrs ago |
|---|---|---|---|---|---|---|---|
| Fla, S | 9.8 | 35 | 1 | 1 | 1 | 2 | 1 |
| Mo, E | 9.6 | 14 | 2 | 18 | 11 | 7 | 11 |
| Ken, E | 7.3 | 8 | 3 | 24 | 61 | 75 | 48 |
| Ill, C | 7.1 | 8 | 4 | 36 | 36 | 68 | 62 |
| S Dakota | 7.0 | 3 | 5 | 23 | 42 | 1 | - |
| Tenn, M | 6.7 | 8 | 6 | 61 | 38 | 65 | 30 |
| Ill, S | 4.7 | 3 | 7 | 3 | 48 | 11 | 62 |
| Mich, E | 4.7 | 15 | 8 | 5 | 4 | 8 | 16 |
| Texas, S | 4.5 | 21 | 9 | 7 | 3 | 45 | 13 |
| Tenn, W | 3.8 | 3 | 10 | 6 | 26 | 5 | 8 |
The Southern District of Florida (Miami) — with 9.8 prosecutions as compared with 1.5 prosecutions per one million people in the United States — was the most active through March 2016. The Southern District of Florida (Miami) was ranked first a year ago as well as five years ago. The district's position ten years ago was second and first twenty years ago.
The Eastern District of Missouri (St. Louis) ranked second.
The Eastern District of Kentucky (Lexington) now ranks third.
The federal judicial district which showed the greatest projected growth in the rate of health care fraud prosecutions compared to one year ago — 1490 percent — was the Middle District of Tennessee (Nashville). Compared to five years ago, the district with the largest projected growth — 1488 percent — was the Eastern District of Kentucky (Lexington).
In the last year, the judicial District Court recording the largest projected drop in the rate of health care fraud prosecutions — 53.8 percent — was the Southern District of Illinois (East St. Louis).Ā
TRAC offers free monthly reports on program categories such as white collar crime, immigration, drugs, weapons and terrorism and on selected government agencies such as the IRS, FBI, ATF and DHS. For the latest information on prosecutions and convictions, go to http://trac.syr.edu/tracreports/bulletins/. In addition, subscribers to the TRACFed data service can generate custom reports for a specific agency, judicial district, program category, lead charge or judge via the TRAC Data Interpreter.