Convictions From FBI Referrals
Continue Gradual Decline
| Number Year-to-date | 10,904 |
|---|---|
| Percent Change from previous year | -0.7 |
| Percent Change from 5 years ago | -2.8 |
| Percent Change from 10 years ago | -10 |
| Percent Change from 20 years ago | -5.5 |
The latest available data from the Justice Department show that during FY 2015 the government reported 10,904 new convictions in matters referred by the Federal Bureau of Investigation. According to the case-by-case information analyzed by the Transactional Records Access Clearinghouse (TRAC), this number is down 0.7 percent over the past fiscal year when the number of convictions totaled 10,979.
The comparisons of the number of defendants convicted for offenses are based on case-by-case information obtained by TRAC under the Freedom of Information Act from the Executive Office for United States Attorneys (see Table 1).
Compared to five years ago when there were 11,218, the number of FY 2015 convictions of this type is down 2.8 percent. Convictions over the past year are lower than they were ten years ago. Overall, the data show that convictions of this type are down 10 percent from the level of 12,109 reported in 2005. In general, since 9/11 when the FBI began focusing more of its attention on terrorism matters, the number of convictions resulting from FBI investigations has been gradually declining.
The long term trend in convictions for these matters going back to FY 1995 is shown more clearly in Figure 1. The vertical bars in Figure 1 represent the number of convictions of this type recorded each fiscal year. Each presidential administration is distinguished by the color of the bars. To view trends month-by-month rather than year-by-year, see TRAC's monthly report series for the latest data.
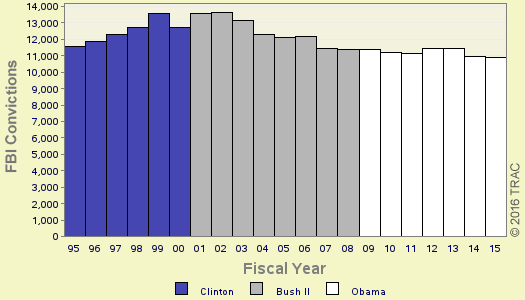
Figure 1. Criminal Convictions over the Last Twenty Years
Leading Program Areas
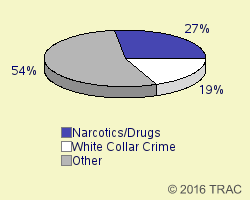
Figure 2. Specific Types of Convictions
Cases were classified by prosecutors into more specific types. The single largest number of convictions of these matters through September 2015 was for "Narcotics/Drugs", accounting for 27.1 percent of convictions.
The second largest number of matters were Convictions filed under the program area of "White Collar Crime " (18.7%). The "Other" category in Figure 2 is comprised of a diverse group of programs. The largest specific programs within the "Other" category were: Weapons" (5.5%) and "Official Corruption" (2.2%).
[The Department of Justice is withholding the program area for 10.4 percent of the cases. These matters are also included in the "Other" category. TRAC, in ongoing litigation, has challenged the government's withholding of program category information, winning a substantial victory in September 2006 decision. The government, however, has filed a notice of appeal which has stayed the order requiring it to release program information.]
Top Ranked Lead Charges
Table 2 shows the top lead charges recorded in the convictions of matters filed in U.S. District Court during FY 2015.
| Lead Charge | Count | Rank | 1 yr ago | 5 yrs ago | 10 yrs ago | 20 yrs ago |
|---|---|---|---|---|---|---|
| 21 USC 841 - Drug Abuse Prevention & Control-Prohibited acts A | 1,420 | 1 | 2 | 3 | 3 | 4 |
| 21 USC 846 - Attempt and conspiracy | 1,383 | 2 | 1 | 2 | 2 | 2 |
| 18 USC 2113 - Bank robbery and incidental crimes | 780 | 3 | 3 | 1 | 1 | 1 |
| 18 USC 2252 - Material involving sexual exploitation of minors | 510 | 4 | 5 | 4 | 8 | 98 |
| 18 USC 1343 - Fraud by wire, radio, or television | 507 | 5 | 4 | 8 | 7 | 8 |
| 18 USC 922 - Firearms; Unlawful acts | 433 | 6 | 6 | 9 | 10 | 15 |
| 18 USC 1951 - Hobbs Act | 415 | 7 | 7 | 10 | 9 | 10 |
| 18 USC 371 - Conspiracy to commit offense or to defraud US | 299 | 8 | 8 | 7 | 6 | 7 |
| 18 USC 1341 - Mail Fraud - Frauds and swindles | 281 | 9 | 10 | 6 | 5 | 5 |
| 18 USC 1344 - Bank Fraud | 256 | 10 | 9 | 5 | 4 | 3 |
"Drug Abuse Prevention & Control-Prohibited acts A" (Title 21 U.S.C Section 841) was the most frequent recorded lead charge. Title 21 U.S.C Section 841 was ranked second a year ago, while it was the third most frequently invoked five years ago. It was ranked third ten years ago and fourth twenty years ago.
Ranked second in frequency was the lead charge "Attempt and conspiracy" under Title 21 U.S.C Section 846. Title 21 U.S.C Section 846 was ranked first a year ago, while it was the second most frequently invoked five years ago. It was ranked second ten years ago and second twenty years ago.
Ranked third was "Bank robbery and incidental crimes" under Title 18 U.S.C Section 2113. Title 18 U.S.C Section 2113 was ranked third a year ago, while it was the first most frequently invoked five years ago. It was ranked first ten years ago and first twenty years ago.
Among these top ten lead charges, the one showing the greatest increase in convictions — up 29.9 percent — compared to one year ago was Title 21 U.S.C Section 841 that involves "Drug Abuse Prevention & Control-Prohibited acts A." This was the same statute that had the largest increase — 60.4 percent — when compared with five years ago.
Again among the top ten lead charges, the one showing the sharpest decline in convictions compared to one year ago — down 22.9 percent — was "Bank Fraud " (Title 18 U.S.C Section 1344 ). This was the same statute that had the largest decrease — 43.1 percent — when compared with five years ago.
Top Ranked Judicial Districts
During FY 2014 the Justice Department said the government obtained 34.4 convictions for every one million people in the United States. convictions for one million people in the United States during FY 2015 were 34.2 . Understandably, there is great variation in the per capita number of convictions in each of the nation's ninety-four federal judicial districts
| Judicial District | Percapita | Count | Rank | 1yr ago | 5yrs ago | 10yrs ago | 20yrs ago |
|---|---|---|---|---|---|---|---|
| D. C. | 176 | 116 | 1 | 1 | 1 | 2 | 1 |
| Montana | 175 | 179 | 2 | 3 | 3 | 3 | 6 |
| S Dakota | 131 | 112 | 3 | 2 | 2 | 1 | 3 |
| N Dakota | 89 | 66 | 4 | 8 | 11 | 19 | 8 |
| N Mexico | 70 | 146 | 5 | 14 | 5 | 7 | 36 |
| Ala, S | 69 | 58 | 6 | 4 | 34 | 6 | 4 |
| Ill, S | 67 | 85 | 7 | 24 | 47 | 42 | 18 |
| Penn, E | 60 | 352 | 8 | 19 | 18 | 17 | 29 |
| Cal, S | 59 | 204 | 9 | 5 | 19 | 57 | 15 |
| Nebraska | 55 | 104 | 10 | 27 | 51 | 26 | 34 |
The District of Washington, D.C. (Washington) — with 176.05 convictions as compared with 34.2 convictions per one million people in the United States — was the most active through September 2015. The District of Washington, D.C. (Washington) was ranked first a year ago as well as five years ago. The district's position ten years ago was second; it was first twenty years ago.
The District of Montana ranked second. The District of Montana was ranked third a year ago as well as five years ago. The district's position ten years ago was third; it was sixth twenty years ago.
The District of South Dakota now ranks third. The District of South Dakota was ranked second a year ago as well as five years ago. The district's position ten years ago was first; it was third twenty years ago.
The federal judicial district which showed the greatest growth in the rate of convictions compared to one year ago — 41.7 percent — was the Southern District of Illinois (East St. Louis). This was the same district that had the largest increase — 100 percent — when compared with five years ago.
In the last year, the judicial District Court recording the largest drop in the rate of convictions — 31.8 percent — was the Southern District of Alabama (Mobile).Ā
TRAC offers free monthly reports on program categories such as white collar crime, immigration, drugs, weapons and terrorism and on selected government agencies such as the IRS, FBI, ATF and DHS. For the latest information on prosecutions and convictions, go to http://trac.syr.edu/tracreports/bulletins/. In addition, subscribers to the TRACFed data service can generate custom reports for a specific agency, judicial district, program category, lead charge or judge via the TRAC Data Interpreter.