Ten Year Decline in Federal Weapons Convictions
| Number Fiscal Year 2015 | 6,002 |
|---|---|
| Percent Change from previous year | -5.8 |
| Percent Change from 5 years ago | -15.5 |
| Percent Change from 10 years ago | -34.8 |
| Percent Change from 20 years ago | 51.6 |
The latest available data from the Justice Department show that during FY 2015 the government reported 6,002 new weapons convictions. According to the case-by-case information analyzed by the Transactional Records Access Clearinghouse (TRAC), this number is down 5.8 percent from the previous fiscal year when the number of convictions totaled 6,373.
The comparisons of the number of defendants convicted for weapons-related offenses are based on case-by-case information obtained by TRAC under the Freedom of Information Act from the Executive Office for United States Attorneys (see Table 1).
Compared to five years ago when there were 7,101 weapons convictions, the number of FY 2015 convictions of this type is down 15.5 percent. Convictions over the past year are lower than they were ten years ago. Overall, the data show that convictions of this type are down 34.8 percent from the level of 9,206 reported in 2005 but up 51.6 percent from the level of 3,958 reported in 1995.
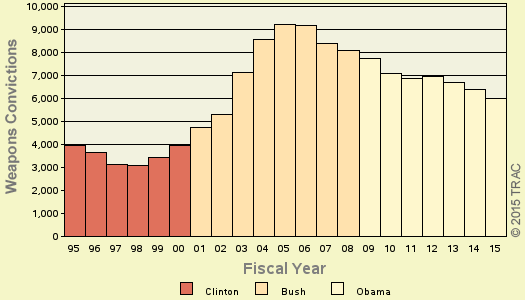
Figure 1. Criminal Weapons Convictions over the Last Twenty Years
The long term trend in weapons convictions going back to FY 1995 is shown more clearly in Figure 1. The vertical bars in Figure 1 represent the number of weapons convictions recorded each fiscal year. Each presidential administration is distinguished by the color of the bars. See TRAC's earlier report for additional background on trends in federal weapons enforcement through FY 2012.
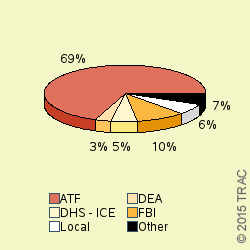
Figure 2. Weapons Convictions
by Investigative Agency
Leading Investigative Agencies
The lead investigative agency for weapons convictions through September 2015 was "Justice - Alcohol, Tobacco, Firearms, and Explosives" accounting for 69.1 percent of convictions.
As shown in Figure 2, additional agencies with substantial numbers of weapons convictions were: "Justice - Federal Bureau of Investigation" (9.9%), "Other - State/Local Authorities" (6.1%), "Homeland Security - Immigration and Customs Enforcement" (5.3%), "Justice - Drug Enforcement Administration" (3%).
Top Ranked Lead Charges
Table 2 shows the top lead charges recorded in the convictions of weapons matters filed in U.S. District Court during FY 2015.
Note: There were an additional 83 other lead charges which were not individually ranked. To get rankings for all lead charges in the most recent month, see TRAC's latest monthly report.
| Lead Charge | Count | Rank | 1 yr ago | 5 yrs ago | 10 yrs ago | 20 yrs ago |
|---|---|---|---|---|---|---|
| 18 USC 922 - Firearms; Unlawful acts | 4,850 | 1 | 1 | 1 | 1 | 1 |
| 18 USC 924 - Firearms; Penalties | 324 | 2 | 2 | 2 | 2 | 2 |
| 18 USC 1951 - Hobbs Act | 202 | 3 | 3 | 4 | 6 | 9 |
| 21 USC 841 - Drug Abuse Prevention & Control-Prohibited acts A | 159 | 4 | 5 | 3 | 3 | 3 |
| 26 USC 5861 - Tax on Making Firearms - Prohibited acts | 97 | 5 | 4 | 5 | 4 | 6 |
| 21 USC 846 - Attempt and conspiracy | 66 | 6 | 6 | 6 | 5 | 4 |
| 18 USC 371 - Conspiracy to commit offense or to defraud US | 50 | 7 | 8 | 7 | 7 | 7 |
| 18 USC 2119 - Carjacking | 34 | 8 | 11 | 11 | 9 | 8 |
| 18 USC 554 - Smuggling goods from the United States | 22 | 9 | 7 | 9 | - | - |
| 18 USC 1962 - RICO - prohibited activities | 20 | 10 | 9 | 42 | 32 | 48 |
"Firearms; Unlawful acts" (Title 18 U.S.C. Section 922) was the most frequently recorded lead charge. Title 18 U.S.C. Section 922 was ranked 1st a year ago, five years ago, ten years ago and twenty years ago.
Ranked 2nd in frequency was the lead charge "Firearms; Penalties" under Title 18 U.S.C. Section 924. Title 18 U.S.C. Section 924 was ranked 2nd a year ago, five years ago, ten years ago and twenty years ago.
Ranked 3rd was "Hobbs Act" under Title 18 U.S.C. Section 1951. Title 18 U.S.C. Section 1951 was ranked 3rd a year ago, while it was the 4th most frequently invoked five years ago. It was ranked 6th ten years ago and 9th twenty years ago.
Among these top ten lead charges, the one showing the greatest increase in convictions — up 78.9 percent — compared to one year ago was Title 18 U.S.C. Section 2119 that involves "Carjacking". This was the same statute that had the largest increase — 1900 percent — when compared with five years ago.
Again among the top ten lead charges, the one showing the sharpest decline in convictions compared to one year ago — down 60.0 percent — was "Smuggling goods from the United States" (Title 18 U.S.C. Section 554). This was the same statute that had the largest decrease — 53.5 percent — when compared with five years ago.
Top Ranked Judicial Districts
During FY 2014 the Justice Department said the government obtained 20.3 weapons convictions for every one million people in the United States. There were 19.1 weapons convictions for one million people in the United States during FY 2015.
Understandably, there is great variation in the per capita number of weapons convictions in each of the nation's ninety-four federal judicial districts. The districts registering the largest number of per capita convictions of this type during FY 2015 are shown in Table 3.
| Judicial District | Per Capita | Count | Rank | 1yr ago | 5yrs ago | 10yrs ago | 20yrs ago |
|---|---|---|---|---|---|---|---|
| Ala, S | 112 | 93 | 1 | 1 | 7 | 6 | 22 |
| Tenn, W | 80 | 126 | 2 | 2 | 1 | 3 | 4 |
| Mo, W | 60 | 185 | 3 | 6 | 10 | 8 | 29 |
| N Car, M | 59 | 168 | 4 | 3 | 3 | 14 | 14 |
| Tenn, E | 56 | 143 | 5 | 5 | 9 | 5 | 25 |
| Iowa, N | 49 | 65 | 6 | 14 | 30 | 50 | 38 |
| Montana | 45 | 45 | 7 | 23 | 14 | 15 | 8 |
| N Mexico | 43 | 89 | 8 | 22 | 11 | 35 | 43 |
| Ill, S | 42 | 54 | 9 | 12 | 28 | 45 | 16 |
| S Dakota | 40 | 33 | 10 | 37 | 34 | 64 | 31 |
The Southern District of Alabama (Mobile) — with 111.5 convictions as compared with 19.1 convictions per one million people in the United States — was the most active through September 2015. This district was ranked 1st a year ago, while it was ranked 7th five years ago. The district's position ten years ago was 6th and 22nd twenty years ago.
The Western District of Tennessee (Memphis) ranked 2nd. This district was ranked 2nd a year ago, while it was ranked 1st five years ago. The district's position ten years ago was 3rd and 4th twenty years ago.
The Western District of Missouri (Kansas City) now ranks 3rd. This district was ranked 6th a year ago, while it was ranked 10th five years ago. The district's position ten years ago was 8th and 29th twenty years ago.
The federal judicial district which showed the greatest growth in the rate of weapons convictions compared to one year ago — 49.9 percent — was South Dakota. Compared to five years ago, the district with the largest growth — 85.3 percent — was the Southern District of Alabama (Mobile).
In the last year, the judicial District Court recording the largest drop in the rate of weapons convictions — 14.8 percent — was the Middle District of North Carolina (Greensboro).
TRAC offers free monthly reports on program categories such as white collar crime, immigration, drugs, weapons and terrorism and on selected government agencies such as the IRS, FBI, ATF and DHS. For the latest information on prosecutions and convictions, go to http://trac.syr.edu/tracreports/bulletins/. In addition, subscribers to the TRACFed data service can generate custom reports for a specific agency, judicial district, program category, lead charge or judge via the TRAC Data Interpreter.