Most Federal Convictions for Minor Offenses
Few Receive Long Sentences
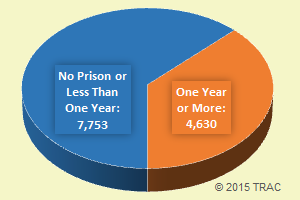
Figure 1. Sentences for Federal
Criminal Convictions, March 2015
During March 2015, the federal government reported the convictions of 12,383 individuals for federal crimes. Only slightly more than one-third (37%) — 4,630 defendants — were sentenced to prison terms of one year or more. The remainder of these convictions — 63 percent — were for offenses that were not judged serious enough to warrant significant prison time (see Figure 1).
Note that for all 12,383 convictions, the median sentence was only 3 months (half got more, half got less). Of the total, 30.5 percent received two weeks or less of jail time, including 17.5 percent that received no jail time at all. At the other extreme, nine individuals were given life sentences.
Information on federal convictions is based on case-by-case information obtained by TRAC under the Freedom of Information Act from the Executive Office for United States Attorneys.
Type of Offense
Cases were classified by prosecutors into more specific types; Table 1 provides a breakdown of these program areas. Immigration offenses dominate federal criminal enforcement outcomes, accounting for more than half of all criminal convictions. However, most of these — six out of every seven — were for minor offenses. Only one out of seven of these immigration convictions was accompanied by a sentence of one year or more in prison.
| Program Category |
Rank | Number of Convictions | Percent of Total | ||||
|---|---|---|---|---|---|---|---|
| Total | Prison Sentence 1 Year or More |
Total | Prison Sentence 1 Year or More |
||||
| No | Yes | No | Yes | ||||
| All Convictions* | 12,383 | 7,753 | 4,630 | 100.0% | 100.0% | 100.0% | |
| Immigration | 1 | 6,606 | 5,667 | 939 | 53.3% | 73.1% | 20.3% |
| Narcotics/Drugs | 2 | 2,214 | 613 | 1,601 | 17.9% | 7.9% | 34.6% |
| White Collar Crime | 3 | 703 | 323 | 380 | 5.7% | 4.2% | 8.2% |
| Weapons | 4 | 640 | 79 | 561 | 5.2% | 1.0% | 12.1% |
| Government Regulatory | 5 | 190 | 146 | 44 | 1.5% | 1.9% | 1.0% |
| Official Corruption | 6 | 56 | 30 | 26 | 0.5% | 0.4% | 0.6% |
| Organized Crime | 7 | 36 | 5 | 31 | 0.3% | 0.1% | 0.7% |
| Environment | 8 | 29 | 22 | 7 | 0.2% | 0.3% | 0.2% |
| Internal Security/Terrorism | 9 | 23 | 9 | 14 | 0.2% | 0.1% | 0.3% |
| Civil Rights | 10 | 19 | 6 | 13 | 0.2% | 0.1% | 0.3% |
Focusing on convictions that resulted in prison sentences, the most common offenses were drug-related. A total of 1,601 or slightly more than one out of three (34.6%) of those receiving prison terms of one year or more were for narcotics or drug offenses. Immigration offenses fell to second place with only 939 convictions, accounting for one out of five (20.3%). In third place, with 561 convictions or 12 percent, were those sentenced for crimes involving weapons.
Other categories of crimes, similar to immigration in that convictions did not result in significant prison time, are also listed among the top ten in Table 1. Those sentenced for government regulatory offenses or environmental crimes were particularly unlikely to receive significant prison time.
Lead Investigative Agency
The immigration and customs components of the Department of Homeland Security accounted for 61.1 percent of all federal convictions in March 2015. Other agencies with substantial numbers of convictions were: the Federal Bureau of Investigation (FBI) with 8.9 percent, the Drug Enforcement Administration (DEA) with 8.3 percent, the Bureau of Alcohol, Tobacco, Firearms and Explosives (ATF) with 5.6 percent, and the Department of Defense (DoD) with 3.2 percent.
| Lead Investigative Agency |
Rank | Number of Convictions | Percent of Total | ||||
|---|---|---|---|---|---|---|---|
| Total | Prison Sentence 1 Year or More |
Total | Prison Sentence 1 Year or More |
||||
| No | Yes | No | Yes | ||||
| All Convictions* | 12,383 | 7,753 | 4,630 | 100.0% | 100.0% | 100.0% | |
| DHS (immigration and customs) | 1 | 7,560 | 6,098 | 1,462 | 61.1% | 78.7% | 31.6% |
| FBI | 2 | 1,105 | 218 | 887 | 8.9% | 2.8% | 19.2% |
| DEA | 3 | 1,025 | 170 | 855 | 8.3% | 2.2% | 18.5% |
| ATF | 4 | 699 | 97 | 602 | 5.6% | 1.3% | 13.0% |
| Defense | 5 | 391 | 377 | 14 | 3.2% | 4.9% | 0.3% |
| Interior | 6 | 266 | 232 | 34 | 2.1% | 3.0% | 0.7% |
| State/Local | 7 | 215 | 31 | 184 | 0.4% | 4.0% | 0.0% |
| Secret Service | 8 | 163 | 63 | 100 | 1.3% | 0.8% | 2.2% |
| Postal Service | 9 | 155 | 75 | 80 | 1.3% | 1.0% | 1.7% |
| IRS | 10 | 145 | 62 | 83 | 1.2% | 0.8% | 1.8% |
As shown in Table 2, investigations by the FBI, DEA and ATF become much more significant when the focus is restricted to convictions that resulted in sentences of at least one year in prison. In contrast, most convictions due to DHS and DoD investigations were for relatively minor offenses. In particular, while investigations by the DHS were responsible for 61.1 percent of all convictions, it was the lead agency for only about one in three (31.6%) convictions resulting in sentences of one year or more.