Government Regulatory Prosecutions
at New Low in December 2014The latest available data from the Justice Department show that during December 2014 the government reported 90 new government regulatory prosecutions, the lowest count for a single month in this program category since 1998. According to the case-by-case information analyzed by the Transactional Records Access Clearinghouse (TRAC), this number is down 41.2 percent over the previous month.
The comparisons of the number of defendants charged with government regulatory-related offenses are based on case-by-case information obtained by TRAC under the Freedom of Information Act from the Executive Office for United States Attorneys (see Table 1).
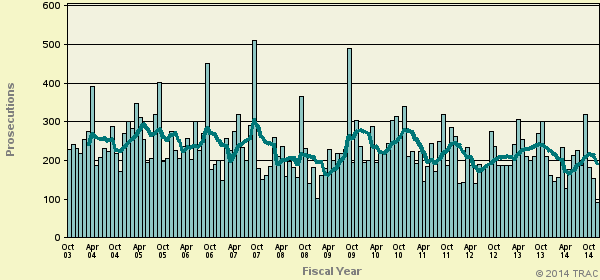
When monthly 2014 prosecutions of this type are compared with those of the same period in the previous year, the number of filings was down (-14.3%). Prosecutions over the past year are still much lower than they were five years ago. Overall, the data show that prosecutions of this type are down 30.5 percent from levels reported in 2009.
The decrease from the levels five years ago in government regulatory prosecutions for these matters is shown more clearly in Figure 1. The vertical bars in Figure 1 represent the number of government regulatory prosecutions of this type recorded on a month-to-month basis. Where a prosecution was initially filed in U.S. Magistrate Court and then transferred to the U.S. District Court, the magistrate filing date was used since this provides an earlier indicator of actual trends. The superimposed line on the bars plots the six-month moving average so that natural fluctuations are smoothed out. The one and five-year rates of change in Table 1 and in the sections that follow are all based upon this six-month moving average.
Within the broad category of government regulatory, cases were classified by prosecutors into more specific types.
Case types within government regulatory are
Counterfeiting and Forgery
Customs Violations - Duty
Customs Violations - Currency
Energy Pricing and Related Fraud
Health and Safety Violations - Employees
Health and Safety Violations - General Public
Copyright Violations
Trafficking in Contraband Cigarettes
Energy Violations - Nuclear Waste Issues
Money Laundering/Structuring (Narcotics)
Money Laundering/Structuring (Other)
Export Enforcement General
Other Government Regulatory Offenses
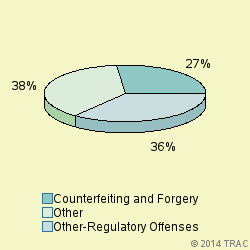
The largest number of prosecutions of these matters in December 2014 was for "Other-Regulatory Offenses", accounting for 35.6 percent of prosecutions. Prosecutions were also filed for "Counterfeiting and Forgery" (26.7%), " Money Laundering-Other" (16.7%), "Customs-Currency Violations" (8.9%), "Money Laundering-Drug" (4.4%), "Customs-Duty Violations" (2.2%), "Export Enforcement General" (2.2%). See Figure 2.
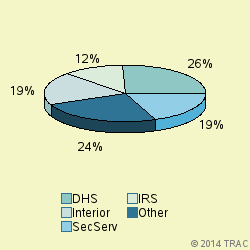
The lead investigative agency for government regulatory prosecutions in December 2014 was DHS accounting for 26 percent of prosecutions referred. Other agencies with substantial numbers of government regulatory referrals were: Interior (19% ), SecServ (19%), IRS (12%). See Figure 3.
Government Regulatory Prosecutions in U.S. Magistrate Courts
Top Ranked Lead Charges
In December 2014, 33 defendants in government regulatory cases for these matters were filed in U.S. Magistrate Courts. These courts handle less serious misdemeanor cases, including what are called "petty offenses." In addition, complaints are sometimes filed in the magistrate courts before an indictment or information is entered. In these cases, the matter starts in the magistrate courts and later moves to the district court where subsequent proceedings take place.
In the magistrate courts in December the most frequently cited lead charge was Title 18 U.S.C Section 19 involving "Petty Offense Defined". This was the lead charge for 33.3 percent of all magistrate filings in December.
Government Regulatory Prosecutions in U.S. District Courts
In December 2014, 57 defendants in new cases for these matters were charged in the U.S. District Courts. In addition during December there were an additional 28 defendants whose cases moved from the magistrate courts to the U.S. district courts after an indictment or information was filed. The sections which follow cover both sets of cases and therefore cover all matters filed in district court during December.
Top Ranked Lead Charges
Table 2 shows the top lead charges recorded in the prosecutions of government regulatory matters filed in U.S. District Court during December 2014.
Lead Charge Count Rank 18 USC 471 - Obligations or securities of United States 16 1 18 USC 1956 - Laundering of monetary instruments 12 2 18 USC 472 - Uttering counterfeit obligations or securities 7 3 18 USC 371 - Conspiracy to commit offense or to defraud US 6 4 31 USC 5332 - Bulk Cash Smuggling into or out of the United States 6 4 18 USC 1028 - Fraud and related activity - id documents 5 6 17 USC 506 - Copyright infringement - Criminal offenses 4 7 18 USC 1343 - Fraud by wire, radio, or television 4 7 31 USC 5316 - Exporting and importing monetary instruments( 3 9 18 USC 1791 - Providing or possessing contraband in prison 2 10 21 USC 331 - Fed Food, Drug & Cosmetics Act - Prohibited acts 2 10 31 USC 5324 - Structuring transactions to evade reporting requir 2 10 36 CFR 2.35b2 - Possession of a controlled substance 2 10 Table 2. Top Charges Filed
"Obligations or securities of United States" (Title 18 U.S.C Section 471) was the most frequent recorded lead charge.
Ranked 2nd in frequency was the lead charge "Laundering of monetary instruments" under Title 18 U.S.C Section 1956.
Ranked 3rd was "Uttering counterfeit obligations or securities" under Title 18 U.S.C Section 472.
Top Ranked Judicial Districts
In December 2014 the Justice Department said the government brought 32.5 government regulatory prosecutions for every ten million people in the United States.
Understandably, there is great variation in the number of government regulatory prosecutions that are filed in each of the nation's ninety-four federal judicial districts.
The districts registering the largest number of prosecutions of this type last month are shown in Table 3.
The Southern District of Texas (Houston) — with 9 prosecutions — was the most active during December 2014.
The Southern District of California (San Diego) ranked 2nd.
Eastern District of Wisconsin (Milwaukee) is now ranking 3rd.
Top Ranked District Judges
Judge Count Rank Bencivengo, Cathy Ann Cal, S 7 1 Clevert, Charles N., Jr. Wisc, E 6 2 Melgren, Eric F. Kansas 5 3 Thompson, Myron Herbert Ala, M 4 4 Hoyt, Kenneth M. Texas, S 4 4 Carman, Mark L. Wyoming 3 6 Zipps, Jennifer Guerin Arizona 2 7 Baker, Kristine Gerhard Ark, E 2 7 O'Neill, Lawrence Joseph Cal, E 2 7 Koh, Lucy Haeran Cal, N 2 7 Magnus-Stinson, Jane Elizabeth Ind, S 2 7 Cerezo, Carmen Consuelo Puer Rico 2 7 Breen, J. Daniel Tenn, W 2 7 Alvarez, Micaela Texas, S 2 7 Hanen, Andrew S. Texas, S 2 7 Nuffer, David Utah 2 7 Table 4. Top Ten Judges
At any one time, there are about 680 federal District Court judges working in the United States. The judges recorded with the largest number of new government regulatory crime cases of this type during December 2014 are shown in Table 4.
A total of 12 out of the "top ten" judges were in districts which were in the top ten with the largest number of government regulatory filings , while the remaining 4 judges were from other districts. (Because of ties, there were a total of 16 judges in the "top ten" rankings.)
Judge Cathy Ann Bencivengo in the Southern District of California (San Diego) ranked 1st with 7 defendants in government regulatory cases.
Judge Charles N. Clevert, Jr. in the Eastern District of Wisconsin (Milwaukee) ranked 2nd with 6 defendants in government regulatory cases.
Judge Eric F. Melgren in the District of Kansas ranked 3rd with 5 defendants in government regulatory cases.
Report Date: February 19, 2015