Federal Drug Prosecutions Fall
to Lowest Level in Over 13 YearsTable 1. Criminal Narcotics/Drugs Prosecutions
Number Latest Month 1,487 Percent Change from previous month -7.8 Percent Change from 1 year ago -11.5 Percent Change from 5 years ago
(including Magistrate Court)-9.3 Percent Change from 5 years ago
(excluding Magistrate Court)-22.6 The monthly count of federal prosecutions for narcotics/drugs offenses has reached its lowest level since May 2000. The latest available data from the Justice Department show there were 1,487 new prosecutions in this category in January 2014, down 7.8 percent from the previous month. The number observed during the most recent six month period appears to be the lowest seen since the end of the Reagan Administration.
The comparisons of the number of defendants charged with narcotics/drugs-related offenses are based on case-by-case information obtained by TRAC under the Freedom of Information Act from the Executive Office for United States Attorneys (see Table 1).
When January's narcotics/drugs prosecutions are compared with those of the same period in the previous year, the number of filings was down 11.5 percent. Prosecutions over the past year are much lower than they were five years ago: overall, the data show that prosecutions of this type are down 9.3 percent from levels reported in 2009.
Figure 1. Monthly Trends in Narcotics/Drugs Prosecutions
The decrease in narcotics/drugs prosecutions from the levels five years ago is shown more clearly in Figure 1, which charts such prosecutions since January 2000. The vertical bars in Figure 1 represent the number of prosecutions of this type recorded on a month-to-month basis. Where a prosecution was initially filed in U.S. Magistrate Court and then transferred to the U.S. District Court, the magistrate filing date was used since this provides an earlier indicator of actual trends.
The superimposed line on the bars plots the six-month moving average so that natural fluctuations are smoothed out. The one and five-year rates of change in Table 1 and in the sections that follow are all based upon this six-month moving average.
Within the broad category of narcotics/drugs, cases were classified by prosecutors into the following more specific types:
- Drug Trafficking
- Simple Drug Possession
- Organized Crime Drug Enforcement Task Force (OCDETF)
- Major Project Triggerlock Prosecutions (OCDETF)
- Other Triggerlock Prosecutions (OCDETF)
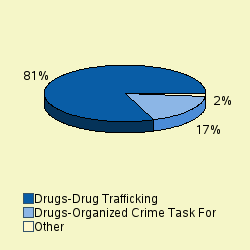
The largest number of prosecutions of these matters in January 2014 was for "Drugs-Drug Trafficking", accounting for 80.8 percent of prosecutions. Prosecutions were also filed for "Drugs-Organized Crime Task Force" (17.5%). See Figure 2.
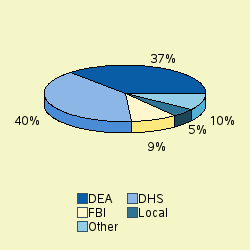
The lead investigative agency for narcotics/drugs prosecutions in January 2014 was DHS accounting for 40 percent of prosecutions referred. Other agencies with substantial numbers of narcotics/drugs referrals were: DEA (37%), FBI (9%), Local (5%). See Figure 3.
Narcotics/Drugs Prosecutions in U.S. Magistrate Courts
Top Ranked Lead Charges
In January 2014, narcotics/drugs charges against 686 defendants were filed in U.S. Magistrate Courts. These courts handle less serious misdemeanor cases, including what are called "petty offenses." In addition, complaints are sometimes filed in the magistrate courts before an indictment or information is entered. In these cases, the matter starts in the magistrate courts and later moves to a district court where subsequent proceedings take place.
In the magistrate courts in January the most frequently cited lead charge was Title 21 U.S.C. Section 846 involving "Attempt and conspiracy". This was the lead charge for 45.6 percent of all magistrate filings in January.
Other frequently prosecuted lead charges include: "21 USC 841 - Drug Abuse Prevention & Control-Prohibited acts A" (36.3%), "21 USC 952 - Importation of controlled substances" (11.4%).
Narcotics/Drugs Prosecutions in U.S. District Courts
In January 2014, 801 defendants in new narcotics/drugs cases were charged in the U.S. district courts. Also during January there were an additional 433 defendants whose cases moved from the magistrate courts to the U.S. district courts after an indictment or information was filed. The sections which follow cover both sets of cases and therefore cover all matters filed in district courts during January.
Top Ranked Lead Charges
Table 2 shows the top lead charges recorded in the prosecutions of narcotics/drugs matters filed in U.S. district courts during January 2014.
Lead Charge Count Rank 1yr ago 5yrs ago 21 USC 841 - Drug Abuse Prevention & Control-Prohibited acts A 679 1 1 1 21 USC 846 - Attempt and conspiracy 406 2 2 2 21 USC 952 - Importation of controlled substances 74 3 3 3 46 USC 70503 - Possession control substance on vessel subject to jurisdiction of US 15 4 9 8 21 USC 963 - Attempt and conspiracy 9 5 4 4 18 USC 1956 - Laundering of monetary instruments 8 6 6 12 18 USC 922 - Firearms; Unlawful acts 6 7 5 6 08 USC 1326 - Reentry of deported alien 5 8 25 19 21 USC 843 - Drug Abuse Prevention & Control-Prohibited acts C 5 8 10 7 18 USC 4 - Misprision of Felony 3 10 17 15 18 USC 1791 - Providing or possessing contraband in prison 3 10 12 20 Table 2. Top Charges Filed
"Drug Abuse Prevention & Control-Prohibited acts A" (Title 21 U.S.C. Section 841) was the most frequent recorded lead charge. "Drug Abuse Prevention & Control-Prohibited acts A" (Title 21 U.S.C. Section 841) was ranked 1 a year ago, while it was ranked 1 five years ago.
Ranked 2nd in frequency was the lead charge "Attempt and conspiracy" under Title 21 U.S.C. Section 846. "Attempt and conspiracy" under Title 21 U.S.C. Section 846 was ranked 2 a year ago, while it was ranked 2 five years ago.
Ranked 3rd was "Importation of controlled substances" under Title 21 U.S.C. Section 952. "Importation of controlled substances" under Title 21 U.S.C. Section 952 was ranked 3 a year ago, while it was ranked 3 five years ago.
Among these top ten lead charges, the one showing the greatest increase in prosecutions — up 60 percent — compared to one year ago was Title 8 U.S.C. Section 1326 that involves "Reentry of deported alien". Compared to five years ago, the largest increase — 128.6 percent — was registered for prosecutions under "Laundering of monetary instruments" (Title 18 U.S.C. Section 1956).
Again among the top ten lead charges, the one showing the sharpest decline in prosecutions compared to one year ago — down 65.6 percent — was Laundering of monetary instruments (Title 18 U.S.C. Section 1956). Compared to five years ago, the most significant decline in prosecutions — 66.7 percent — was for filings where the lead charge was "Misprision of Felony" (Title 18 U.S.C. Section 4).
Top Ranked Judicial Districts
In January 2014 the Justice Department said the government brought 4.7 narcotics/drugs prosecutions for every hundred thousand people in the United States. Understandably, there is great variation in the per capita number of narcotics/drugs prosecutions that are filed in each of the nation's ninety-four federal judicial districts.
The districts registering the largest number of prosecutions per capita for these matters in January 2014 are shown in Table 3. Districts must have at least 5 narcotics/drugs prosecutions to receive a ranking.
Table 3. Top Districts (per Hundred Thousand People)
Judicial District Per capita Count Rank 1yr ago 5yrs ago W Virg, N 33.7 26 1 54 44 N Mexico 32.8 57 2 7 9 Cal, S 27.6 77 3 1 2 N Dakota 24.0 14 4 46 47 Arizona 23.8 130 5 4 5 Ark, E 22.8 31 6 35 53 Texas, W 14.9 82 7 3 1 Iowa, N 14.5 16 8 40 56 Tenn, W 12.9 17 9 33 38 Alaska 11.7 7 10 79 77 R. I. 11.4 10 11 66 78 Texas, S 9.7 72 12 2 3 Ga, M 9.6 16 13 37 63 S Dakota 8.6 6 14 68 80 Wash, E 8.6 11 14 69 25 Ohio, N 8.5 41 16 25 55 Ill, S 8.4 9 17 40 60 Texas, E 7.8 24 18 9 22 Hawaii 7.8 9 19 75 41 Conn 7.7 23 20 70 85 Ken, W 7.6 14 21 77 70 Ala, S 7.2 5 22 53 51 Penn, M 7.2 19 22 80 64 Kansas 7.1 17 24 11 26 Ken, E 6.1 11 25 20 14 Oregon 5.9 19 26 49 42 Mo, W 5.8 15 27 13 29 Wisc, W 5.6 11 28 73 82 Maine 5.4 6 29 75 79 Fla, S 4.7 27 30 10 4 N. Y., N 4.5 13 31 32 33 N Car, W 4.3 11 32 46 57 Wisc, E 4.3 12 33 38 40 Tenn, E 4.2 9 34 17 27 Okla, W 3.5 6 35 56 81 Utah 3.4 8 36 42 35 Penn, E 3.1 15 37 28 30 Ga, N 3.0 16 38 24 13 Virg, E 3.0 15 39 18 20 N. Y., W 3.0 7 40 22 19 N. Y., S 2.8 12 41 8 10 Texas, N 2.6 15 42 16 18 Ala, N 2.5 6 43 78 69 S Car 2.5 10 43 31 34 Fla, M 2.5 22 45 12 7 Ohio, S 2.5 12 45 23 44 N Car, E 2.2 7 47 21 17 N Car, M 2.1 5 48 59 27 Mich, E 1.7 9 49 58 22 Cal, N 1.7 11 50 45 43 Penn, W 1.6 5 51 73 72 Ill, N 1.5 12 52 14 16 Cal, C 1.4 22 53 6 12 Cal, E 1.2 8 54 15 8 N. J. 1.1 8 55 29 21 Mass 0.9 5 56 29 72 N. Y., E 0.7 5 57 19 11
The Northern District of West Virginia (Wheeling) — with 33.7 prosecutions as compared with 4.7 prosecutions per hundred thousand population in the United States — was the most active during January 2014.
The District of New Mexico ranked 2nd. The District of New Mexico was ranked 7 a year ago, while it was ranked 9 for most frequent use five years ago.
The Southern District of California (San Diego) is now ranking 3rd. The Southern District of California (San Diego) was ranked 1 a year ago, while it was ranked 2 for most frequent use five years ago.
The federal judicial district which showed the greatest growth in the rate of narcotics/drugs prosecutions compared to one year ago — 79.6 percent — was the Northern District of West Virginia (Wheeling). Compared to five years ago, the district with the largest growth — 62.3 percent — was Arizona.
In the last year, the judicial district court recording the largest drop in the rate of narcotics/drugs prosecutions — 44.9 percent — was the Western District of Tennessee (Memphis). But over the past five years, the Western District of Texas (San Antonio) showed the largest drop — 43.5 percent.
Top Ranked District Judges
At any one time, there are about 680 federal district court judges working in the United States. The judges with the largest recorded number of new narcotics/drugs crime cases during January 2014 are shown in Table 4.
Judge Count Rank 1yr ago 5yrs ago Lioi, Sara Elizabeth Ohio, N 30 1 558 - Junell, Robert A. Texas, W 30 1 1 1 Perez-Gimenez, Juan Manuel Puer Rico 27 3 558 - Miller, Brian Stacy Ark, E 25 4 270 310 Zipps, Jennifer Guerin Arizona 23 5 27 - Jorgenson, Cindy K. Arizona 22 6 4 65 Collins, Raner Christercunean Arizona 19 7 12 42 Brack, Robert C. N Mexico 18 8 8 35 Breen, J. Daniel Tenn, W 15 9 89 57 Hall, Janet C. Conn 14 10 475 - Table 4. Top 10 Judges
A total of 7 out of the "top ten" judges were in districts which were in the top ten with the largest number of narcotics/drugs filings per capita, while the remaining 3 judges were from other districts.
Judges Sara Elizabeth Lioi in the Northern District of Ohio (Cleveland) and Robert A. Junell in the Western District of Texas (San Antonio) ranked 1st with 30 defendants in narcotics/drugs cases. Judge Junell appeared in the top ten rankings one year (ranked 1) and five years ago (rank 1).
Judge Juan Manuel Perez-Gimenez in the District of Puerto Rico ranked 3rd with 27 defendants in narcotics/drugs cases.
Report Date: March 18, 2014