Slump in FBI White Collar Crime Prosecutions
Table 1. FBI White Collar Prosecutions
Number Year-to-date 2,001 Percent Change from previous year -6.8 Percent Change from 5 years ago -1.2 Percent Change from 10 years ago -45.2 Percent Change from 20 years ago -55.8
Prosecutions of white collar criminals recommended by the FBI are substantially down during the first ten months of Fiscal Year 2013, according to the latest available data obtained under the Freedom of Information Act from the Department of Justice.
If the FBI's white collar crime prosecutions continue at the same pace for the remaining two months of the current fiscal year, an analysis by the Transactional Records Access Clearinghouse estimates that the FY 2013 total will be nearly 7 percent (6.8%) lower than it was in the previous year, 1.2 percent lower than three years ago, and only about half what it was ten years ago — down 45.2 percent.
While the FBI has long been considered the federal government's premier agency when it comes to white collar crime, and the number of its criminal investigators has increased (from 11,097 in 2001 to 13,812 in 2012), the 9/11 attacks of 2001 prompted the agency to focus more and more of its investigative powers on trying to deal with international and domestic terrorism and weapons of mass destruction.
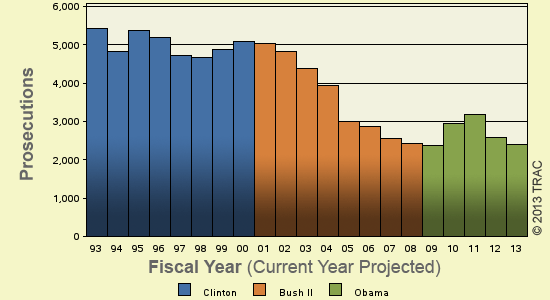
The long term trend in white collar crime prosecutions recommended by the FBI going back to FY 1993 is shown more clearly in Figure 1. The vertical bars in Figure 1 represent the number of these prosecutions recorded each fiscal year. Projected figures for the current fiscal year are shown. Each presidential administration is distinguished by the color of the bars.
Leading Program Categories
Within the broad category of white collar crime, cases were classified by prosecutors into more specific types. All white collar program categories are listed in Table 2, along with the number of prosecutions through July 2013 and the percentage of all white collar prosecutions contributed by each category.
Table 2. FBI White Collar Crime Program Categories (First 10 Months FY 2013)
Program Category Prosecutions Filed % of White Collar
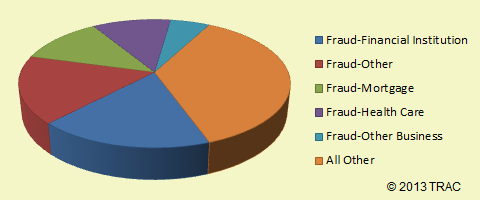
Prosecutions Filed-All- 2,001 100.0% Fraud-Financial Institution 355 17.7% Fraud-Other 341 17.0% Fraud-Mortgage 240 12.0% Fraud-Health Care 221 11.0% Fraud-Other Business 111 5.5% Fraud-Federal Program 99 4.9% Fraud-Securities 97 4.8% Fraud-Computer 96 4.8% Fraud-Other Investment 81 4.0% Fraud-Tax 51 2.5% Fraud-Corporate 49 2.4% Fraud-Identity Theft-Other 45 2.2% Fraud-Consumer 35 1.7% Fraud-Identity Theft-Aggravated 34 1.7% Fraud-Federal Procurement 32 1.6% Fraud-Bankruptcy 28 1.4% Fraud-Against Ins. Provider 27 1.3% Fraud-Intellectual Property Violations 24 1.2% Fraud-Advance Fee Schemes 15 0.7% Fraud-Telemarketing 13 0.6% Fraud-Commodities 4 0.2% Antitrust-Other Finance Mkts. 2 0.1% Fraud-Insider Ins. Provider 1 0.0% Antitrust-Banking 0 0.0% Antitrust-Other 0 0.0% Antitrust-Unspecified 0 0.0% Fraud-MEWA/MET 0 0.0% Fraud-Other Insurance 0 0.0% Fraud-Unspecified Insurance 0 0.0% Fraud-Unspecified 0 0.0% The single largest number of white collar crime prosecutions through July 2013 was for "Fraud-Financial Institution," accounting for 17.7 percent of prosecutions.
The second largest number of matters were prosecutions filed under the program area of "Fraud-Other" (17%). Other categories with significant numbers were "Fraud-Mortgage" (12%), "Fraud-Health Care" (11%) and "Fraud-Other Business" (5.5%). All remaining categories collectively accounted for 36.6 percent of white collar crime prosecutions. See Figure 2.
Top Ranked Lead Charges
Table 3 shows the top lead charges recorded in the white collar crime prosecutions referred by the FBI that were filed in U.S. District Court during the first ten months of FY 2013. (Note: There were an additional 158 other lead charges which were not individually ranked.)
Table 3. Top FBI White Collar Crime Charges Filed
Lead Charge Count Rank Current 1 yr ago 5 yrs ago 10 yrs ago 20 yrs ago 18 USC 1343 - Fraud by wire, radio, or television 390 1 1 2 3 4 18 USC 1349 - Mail Fraud - Attempt and Conspiracy 252 2 4 6 115 - 18 USC 1344 - Bank Fraud 221 3 3 1 1 1 18 USC 1341 - Mail Fraud - Frauds and swindles 213 4 2 3 2 3 18 USC 371 - Conspiracy to commit offense or to defraud US 174 5 5 4 5 5 18 USC 1347 - Health Care Fraud 140 6 6 5 6 122 18 USC 1084 - Gambling ships - transmit of wagering information 58 7 88 - - 122 18 USC 656 - Theft/embezzlement/misapplication by bank off, emp 54 8 9 7 4 2 18 USC 1030 - Fraud and related activity - computers 42 9 8 9 11 36 18 USC 1029 - Fraud and related activity - access devices 40 10 11 10 9 18 "Fraud by wire, radio, or television" (Title 18 USC Section 1343) was the most frequently recorded lead charge. Next in frequency was "Mail Fraud - Attempt and Conspiracy" under Title 18 USC Section 1349. Third was "Bank Fraud" under Title 18 USC Section 1344.
Among these top ten lead charges, the one showing the greatest projected increase in prosecutions — up 26.3 percent — compared to one year ago was Title 18 USC Section 1029 that involves "Fraud and related activity - access devices." The sharpest projected decline compared to one year ago — down 31.3 percent — is seen in "Mail Fraud - Frauds and swindles " (Title 18 USC Section 1341).
Top Ranked Judicial Districts
During FY 2012 the Justice Department said the government obtained 8.4 white collar crime prosecutions for every one million people in the United States. If the pace seen during the first ten months of FY 2013 continues at the same rate, there will be 7.8 white collar crime prosecutions per one million people in the United States this year. Understandably, there is great variation in the per capita number of white collar crime prosecutions in each of the nation's ninety-four federal judicial districts; Table 4 lists the ten districts with the greatest per capita count of white collar crime prosecutions so far in FY 2013.
Table 4. Top 10 Districts (Per One Million People)
Judicial
DistrictPer Capita Count Rank Current 1yr ago 5yrs ago 10yrs ago 20yrs ago Okla, W 40 65 1 49 41 31 20 Ga, S 33 40 2 72 18 19 40 Ala, S 28 19 3 24 46 7 4 Fla, S 24 131 4 2 1 4 15 N. Y., S 22 95 5 1 2 3 11 N Car, W 22 54 6 11 25 50 10 D. C. 20 10 7 10 22 2 1 Cal, S 19 51 8 6 19 8 7 S Car 17 66 9 30 38 5 25 Ala, N 16 37 10 8 52 6 56 The Western District of Oklahoma (Oklahoma City) — with 40 prosecutions as compared with 7.8 prosecutions per one million people in the United States — was the most active through July 2013. Second was the Southern District of Georgia (Savannah), followed by the Southern District of Alabama (Mobile) in third place.
The federal judicial district which showed the greatest projected growth in the rate of white collar crime prosecutions compared to one year ago — 860 percent — was the Southern District of Georgia (Savannah). Compared to five years ago, the district with the largest projected growth — 492 percent — was the Western District of Oklahoma (Oklahoma City).
In the last year, the judicial District Court recording the largest projected drop in the rate of white collar crime prosecutions — 27.8 percent — was the Southern District of New York (Manhattan).
Report Date: September 24, 2013