Fourfold Increase in Prosecutions of Child Sex Trafficking Crimes Since 2008
Prosecutions for 18 USC 1591 through June 2013
Number Year-to-date 130 Percent Change from previous year 25.4 Percent Change from 5 years ago 394 Percent Change from 10 years ago 2783
Table 1. Criminal ProsecutionsThe latest available data from the Justice Department show that during the first nine months of FY 2013 the government reported 130 new prosecutions for cases with a lead charge of 18 USC 1591. This statute, part of the Trafficking Victims Protection Act of 2000, applies to anyone who causes a person under the age of 18 to engage in a commercial sex act through the use of force, fraud, or coercion, or conduct. If these enforcement actions continue at the same pace, the annual total of prosecutions will be 173 for this fiscal year. According to the case-by-case information analyzed by the Transactional Records Access Clearinghouse (TRAC), this estimate is up 25.4 percent over the past fiscal year when the number of prosecutions totaled 138.
The comparisons of the number of defendants charged with these offenses are based on case-by-case information obtained by TRAC under the Freedom of Information Act from the Executive Office for United States Attorneys (see Table 1).
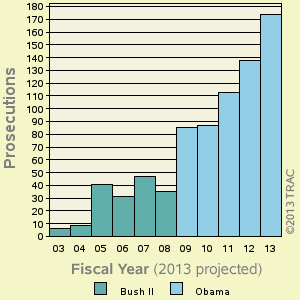
Figure 1. Criminal Prosecutions
over the Past 10 YearsCompared to five years ago when there were 35, the estimate of FY 2013 prosecutions of this type is up 394 percent. Prosecutions over the past year are much higher than they were ten years ago. Overall, the data show that prosecutions of this type are up 2,783 percent from the level of 6 reported in 2003.
The long term trend in prosecutions for child sex trafficking going back to FY 1993 is shown more clearly in Figure 1. The vertical bars in Figure 1 represent the number of prosecutions for this law recorded each fiscal year. Projected figures for the current fiscal year are shown. Each presidential administration is distinguished by the color of the bars.
Leading Program Areas
Cases were classified by prosecutors into more specific types. The single largest number of prosecutions of these matters through June 2013 was for "Civil Rights", accounting for 36.2 percent of prosecutions. See Figure 2.
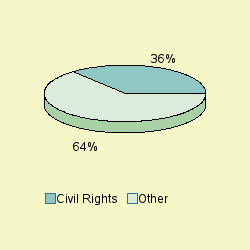
Figure 2. Specific Types of Prosecutions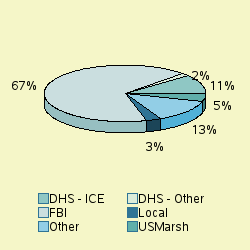
Figure 3. Prosecutions by Investigative Agency
Leading Investigative Agencies
The lead investigative agency for prosecutions through June 2013 was "Justice - Federal Bureau of Investigation" accounting for 66.9 percent of prosecutions referred.
As shown in Figure 3, additional agencies with substantial numbers of referrals were: Homeland Security - Immigration and Customs Enforcement (10.8 percent), "Justice - US Marshal' Service" (4.6 percent), "Other - State/Local Authorities" (3.1 percent).
Top Ranked Judicial Districts
Judicial District Count Rank N. Y., S 14 1 Tenn, W 13 2 Cal, S 11 3 Ga, N 11 3 Oregon 8 5 Fla, S 6 6 N. Y., W 6 6 Mass 5 8 Ark, E 4 9 Cal, E 4 9 Kansas 4 9 Minnesota 4 9 Nevada 4 9
Table 2. Top 10 Districts
Understandably, there is great variation in the number of prosecutions in each of the nation's ninety-four federal judicial districts. The districts registering the largest number of prosecutions of this type during the first nine months of FY 2013 are shown in Table 3.
The Southern District of New York (Manhattan) — with 14 prosecutions — was the most active through June 2013.
The Western District of Tennessee (Memphis) ranked second.
The Southern District of California (San Diego) and Northern District of Georgia (Atlanta) now rank third.
Report Date: August 21, 2013
