Racial Violence Civil Rights Convictions for 2013
Number Year-to-date 11 Percent Change from previous year -32 Percent Change from 5 years ago 6.3 Percent Change from 10 years ago 21.4
Table 1: Criminal Racial Violence
Civil Rights ConvictionsThe latest available data from the Justice Department show that during the first eight months of FY 2013 the government reported 11 new convictions under the program category of civil rights — racial violence. If this activity continues at the same pace, the annual total of convictions will be 17 for this fiscal year. According to the case-by-case information analyzed by the Transactional Records Access Clearinghouse (TRAC), this estimate is down 32% over the past fiscal year when the number of convictions totaled 25.
The comparisons of the number of defendants convicted for racial violence civil rights offenses are based on case-by-case information obtained by TRAC under the Freedom of Information Act from the Executive Office for United States Attorneys (see Table 1).
Compared to five years ago when there were 16, the estimate of FY 2013 convictions of this type is up 6.3 percent. Convictions over the past year are higher than they were ten years ago. Overall, the data show that convictions of this type are up 21.4 percent from the level of 14 reported in 2003.
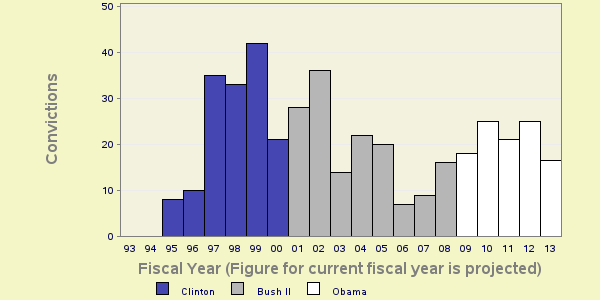
The long term trend in racial violence civil rights convictions going back to FY 1995 (when the program category was created) is shown more clearly in Figure 1. The vertical bars in Figure 1 represent the number of racial violence civil rights convictions of this type recorded each fiscal year. Projected figures for the current fiscal year are shown. Each presidential administration is distinguished by the color of the bars.
Most Cases Not Prosecuted
Not all referrals to federal prosecutors for civil rights offense involving racial violence go forward with an actual prosecution. During the current fiscal year federal, prosecutors closed three-quarters (76%) of these referrals without taking any court action. By comparison, the turn-down rate for prosecutions for all civil rights cases in the current fiscal year was 81 percent.
However, federal prosecutors usually obtain convictions in those cases they decide to prosecute. The 11 defendants convicted of racial violence so far in FY 2013 represent 92 percent of all prosecutions completed for this offense. For civil rights cases in general, 88 percent of defendants have been convicted.
Leading Investigative Agencies
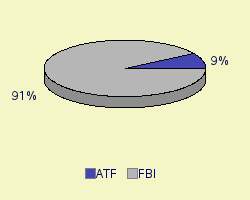
The lead investigative agency for racial violence civil rights convictions through May 2013 was the Federal Bureau of Investigation in the Department of Justice, accounting for 90.9 percent of convictions.
As shown in Figure 2, the only other agency with a substantial number of racial violence civil rights convictions was Alcohol, Tobacco, Firearms, and Explosives (9.1%) in the Department of Justice.
Report Date: July 23, 2013