Securities and Commodities Exchange Litigation Up 37 Percent
| Number Latest Month | 128 |
| Percent Change from previous month | 23.1% |
| Percent Change from 1 year ago | 36.7% |
| Percent Change from 5 years ago | 7.9% |
The latest available data from the federal courts show that during May 2017 the government reported 128 new securities and commodities exchange civil filings. According to the case-by- case information analyzed by the Transactional Records Access Clearinghouse (TRAC) at Syracuse University, this number is up 23.1 percent over the previous month when the number of civil filings of this type totaled 104. When monthly 2017 civil filings of this type are compared with those of the same period in the previous year, their number was up by more than a third (36.7%). See Table 1.
Suits in this category involve alleged violations of the Securities and Exchange Act (15 USC 78), securities fraud under 15 USC 77 and 12 USC 22, violations of commodities exchange regulations and other breaches of fiduciary duties. The comparisons of the number of civil filings for securities/commodities/exchange-related suits are based on case-by-case court records which were compiled and analyzed by TRAC.
The long term trend in securities and commodities exchange civil filings going back five years is shown more clearly in Figure 1. The vertical bars in Figure 1 represent the number of civil filings of this type recorded each month. The superimposed line on the bars plots the six-month moving average so that natural fluctuations are smoothed out. One-year and five-year change comparisons are based upon the moving averages.
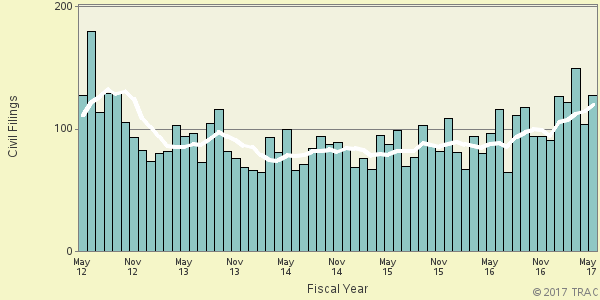
Figure 1. Securities/Commodities/Exchange Civil Filings Over the Last Five Years
Top Ranked Judicial Districts
Suits of this type tended to be concentrated in just a few of the 94 federal judicial districts. Half of all securities and commodities exchange suits that have been filed during the first eight months of this fiscal year were filed in just five districts. The Southern District of New York (Manhattan) had the largest number of filings. In May 2017 alone there were 26 suits filed in this district, and a total of 198 were filed so far this fiscal year. This was followed by the Northern District of California (San Francisco), the Central District of California (Los Angeles), New Jersey, and Delaware. See Table 2.
Relative to population size, Delaware had the highest volume of these lawsuits with a rate 20 times the national average. New York South's rate relative to its population was second, with over 13 times the national average this year.
The number of securities and commodities exchange civil filings in each district, along with their per capita filings rates, during the first eight months of FY 2017 are shown in Table 2. Districts not listed had no filings.
| Federal Judicial District | Number | Rank | ||
|---|---|---|---|---|
| Filings | Rate | Filings | Rate | |
| All Districts | 910 | 2.8 | ||
| N. Y., S | 198 | 37.7 | 1 | 2 |
| Cal, N | 80 | 9.6 | 2 | 4 |
| Cal, C | 70 | 3.6 | 3 | 13 |
| N. J. | 57 | 6.4 | 4 | 5 |
| Delaware | 52 | 55.0 | 5 | 1 |
| N. Y., E | 35 | 4.2 | 6 | 11 |
| Mass | 33 | 4.9 | 7 | 7 |
| Fla, S | 29 | 4.0 | 8 | 12 |
| Penn, E | 25 | 4.3 | 9 | 10 |
| Cal, S | 20 | 5.7 | 10 | 6 |
| Colorado | 19 | 3.5 | 11 | 14 |
| Ill, N | 19 | 2.0 | 11 | 25 |
| Texas, N | 18 | 2.5 | 13 | 19 |
| Conn | 17 | 4.7 | 14 | 8 |
| Virg, E | 17 | 2.7 | 14 | 18 |
| Texas, S | 15 | 1.6 | 16 | 29 |
| Minnesota | 13 | 2.4 | 17 | 21 |
| D. C. | 11 | 16.4 | 18 | 3 |
| Texas, E | 11 | 2.9 | 18 | 17 |
| Arizona | 11 | 1.6 | 18 | 29 |
| Texas, W | 11 | 1.6 | 18 | 29 |
| Ind, S | 10 | 2.5 | 22 | 19 |
| Maryland | 10 | 1.7 | 22 | 27 |
| Utah | 9 | 3.0 | 24 | 15 |
| Mich, E | 9 | 1.4 | 24 | 34 |
| Wash, W | 8 | 1.4 | 26 | 34 |
| N Car, W | 7 | 2.2 | 27 | 23 |
| Fla, M | 7 | 0.6 | 27 | 49 |
| Ga, N | 6 | 0.9 | 29 | 45 |
| Okla, N | 5 | 4.7 | 30 | 8 |
| Tenn, M | 5 | 2.1 | 30 | 24 |
| N Car, M | 5 | 1.7 | 30 | 27 |
| Ark, W | 4 | 3.0 | 33 | 15 |
| La, E | 4 | 2.4 | 33 | 21 |
| Okla, W | 4 | 1.9 | 33 | 26 |
| Mo, E | 4 | 1.4 | 33 | 34 |
| Nevada | 4 | 1.4 | 33 | 34 |
| Penn, W | 4 | 1.1 | 33 | 42 |
| Oregon | 4 | 1.0 | 33 | 43 |
| S Car | 4 | 0.8 | 33 | 48 |
| Puer Rico | 3 | na | 41 | na |
| Ind, N | 3 | 1.2 | 41 | 39 |
| Wisc, E | 3 | 0.9 | 41 | 45 |
| Ohio, N | 3 | 0.5 | 41 | 53 |
| Ohio, S | 3 | 0.5 | 41 | 53 |
| Iowa, N | 2 | 1.5 | 46 | 33 |
| Ken, E | 2 | 0.9 | 46 | 45 |
| Vermont | 1 | 1.6 | 48 | 29 |
| N Dakota | 1 | 1.3 | 48 | 38 |
| Ala, S | 1 | 1.2 | 48 | 39 |
| S Dakota | 1 | 1.2 | 48 | 39 |
| Montana | 1 | 1.0 | 48 | 43 |
| Ark, E | 1 | 0.6 | 48 | 49 |
| Iowa, S | 1 | 0.6 | 48 | 49 |
| Idaho | 1 | 0.6 | 48 | 49 |
| Ga, M | 1 | 0.5 | 48 | 53 |
| Miss, S | 1 | 0.5 | 48 | 53 |
| Nebraska | 1 | 0.5 | 48 | 53 |
| Virg, W | 1 | 0.5 | 48 | 53 |
| Tenn, E | 1 | 0.4 | 48 | 59 |
| Wisc, W | 1 | 0.4 | 48 | 59 |
| Mo, W | 1 | 0.3 | 48 | 61 |
| N. Y., N | 1 | 0.3 | 48 | 61 |
| Penn, M | 1 | 0.3 | 48 | 61 |
Each month, TRAC offers a free report focused on one area of civil litigation in the U.S. district courts. In addition, subscribers to the TRACFed data service can generate custom reports by district, office, nature of suit or federal jurisdiction via the TRAC Data Interpreter.