Continued Decline in New Patent Lawsuits
| Fiscal Year | Filings | Rate* |
|---|---|---|
| 2008 | 2,919 | 9.6 |
| 2009 | 2,792 | 9.1 |
| 2010 | 3,326 | 10.8 |
| 2011 | 4,027 | 12.9 |
| 2012 | 5,201 | 16.6 |
| 2013 | 6,504 | 20.6 |
| 2014 | 5,698 | 17.9 |
| 2015 | 5,564 | 17.5 |
| 2016 (first 8 months) | 3,478 | 16.4 |
The latest available data from the federal courts show that the government reported 3,478 new patent civil filings during the first eight months of FY 2016. If filings continue at the same pace for the remaining four months, an estimated total of 5,217 new filings of this type will occur. According to the case-by-case information analyzed by Syracuse University's Transactional Records Access Clearinghouse (TRAC), this number will be down 6.2 percent from FY 2015 when there were 5,564 civil filings of this type.
The comparisons of the number of civil filings for patent-related suits are based on case-by-case court records which were compiled and analyzed by TRAC (see Table 1).
Patent lawsuits involve alleged violations of any one of a number of statutes, the most common involving patent infringement under Title 15, Section 1126; Title 28, Section 1338; and Title 35, Sections 145 and 271. Other suits seek a declaratory judgment under Title 28, Section 2201.
The long term trend in patent civil filings going back to FY 2008 can be seen more clearly in Figure 1. The vertical bars in Figure 1 represent the number of filings of this type recorded each fiscal year. The annual number of patent lawsuits climbed from FY 2009 until reaching a peak in FY 2013 and has since been falling. The pace of filings so far during FY 2016 is down 19.8 percent compared with the FY 2013 peak when there were 6,504 new patent lawsuits.
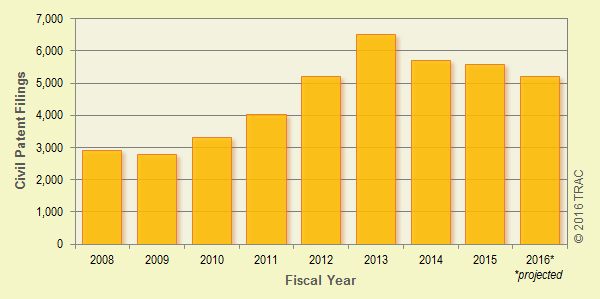
Figure 1. Civil Patent Lawsuits Filed, FY 2008 — FY 2016 (projected)
District Comparisons
One striking aspect of federal patent litigation is the dominance of a single district — the Eastern District of Texas. That district alone accounted for nearly four out of every ten patent lawsuits (39.7%) that were filed nationwide during the first eight months of FY 2016. Relative to its population, the rate of filings was more than 33 times the national average. Texas East also led the nation in the two prior years, as shown in Table 2.
In an earlier report from October 2014, TRAC had noted that "rocket docket" procedures in Texas East, intended to speed the resolution of complex cases, make it a popular venue for filing patent lawsuits.
Delaware also stands out in terms of having a large number of patent lawsuits filed relative to population, about 32 times the national average. While being much smaller in population than the Eastern District of Texas, Delaware accounted for almost one out ten (9.3%) patent lawsuits filed nationwide. Many companies are incorporated in Delaware, which may help explain why so many cases get filed there.
Taken together, all the remaining federal judicial districts account for only about half (51%) of the patent lawsuits filed during the first eight months of FY 2016. District-by-district numbers and per capita rates can be found in Table 2.
| District | FY 2016 (through May) | Number - Prior Years | Rate - Prior Years* | |||||
|---|---|---|---|---|---|---|---|---|
| Number | Rate* | FY 2013 | FY 2014 | FY 2015 | FY 2013 | FY 2014 | FY 2015 | |
| -All- | 3,478 | 10.9 | 6,504 | 5,698 | 5,564 | 20.6 | 17.9 | 17.5 |
| Alaska | 1 | 1.4 | 1 | 0 | 0 | 1.4 | - | - |
| Ala, M | 1 | 0.9 | 1 | 2 | 1 | 0.9 | 1.7 | 0.9 |
| Ala, S | 2 | 2.4 | 9 | 12 | 7 | 3.2 | 4.2 | 2.4 |
| Ark, E | 3 | 1.8 | 6 | 1 | 7 | 3.7 | 1.2 | 4.3 |
| Ark, W | 1 | 0.8 | 4 | 4 | 2 | 3 | 2.4 | 1.5 |
| Arizona | 19 | 2.8 | 44 | 30 | 22 | 6.6 | 4.5 | 3.3 |
| Cal, C | 201 | 10.4 | 476 | 361 | 267 | 24.9 | 18.7 | 13.9 |
| Cal, E | 2 | 0.3 | 17 | 17 | 3 | 2.2 | 2.2 | 0.4 |
| Cal, N | 141 | 17.2 | 262 | 246 | 248 | 32.3 | 30 | 30.2 |
| Cal, S | 70 | 20.3 | 196 | 136 | 95 | 57.6 | 39.5 | 27.6 |
| Colorado | 33 | 6.2 | 75 | 34 | 49 | 14.2 | 6.3 | 9.1 |
| Conn | 29 | 8.1 | 39 | 33 | 29 | 10.8 | 9.2 | 8.1 |
| D. C. | 6 | 9.1 | 12 | 6 | 3 | 18.5 | 9.1 | 4.6 |
| Delaware | 323 | 345.2 | 1490 | 1122 | 661 | 1610.4 | 1199.2 | 706.5 |
| Fla, M | 43 | 3.9 | 69 | 96 | 81 | 6.4 | 8.8 | 7.4 |
| Fla, N | 9 | 5 | 6 | 5 | 2 | 3.4 | 2.8 | 1.1 |
| Fla, S | 107 | 15 | 234 | 130 | 168 | 33.2 | 18.2 | 23.5 |
| Ga, M | 3 | 1.5 | 2 | 8 | 5 | 1 | 4 | 2.5 |
| Ga, N | 30 | 4.6 | 62 | 45 | 68 | 9.6 | 6.9 | 10.4 |
| Ga, S | 0 | - | 10 | 1 | 5 | 6.5 | 0.6 | 3.2 |
| Hawaii | 0 | - | 2 | 7 | 5 | 1.4 | 4.9 | 3.5 |
| Iowa, N | 2 | 1.5 | 5 | 2 | 2 | 3.8 | 1.5 | 1.5 |
| Iowa, S | 3 | 1.7 | 13 | 5 | 8 | 7.4 | 2.8 | 4.5 |
| Idaho | 4 | 2.4 | 5 | 5 | 2 | 3.1 | 3.1 | 1.2 |
| Ill, C | 2 | 0.9 | 4 | 1 | 3 | 1.8 | 0.4 | 1.3 |
| Ill, N | 159 | 17 | 217 | 167 | 144 | 23.2 | 17.8 | 15.4 |
| Ill, S | 0 | - | 1 | 2 | 1 | 0.8 | 1.6 | 0.8 |
| Ind, N | 5 | 1.9 | 9 | 11 | 10 | 3.5 | 4.3 | 3.9 |
| Ind, S | 9 | 2.2 | 30 | 28 | 18 | 7.5 | 7 | 4.5 |
| Kansas | 0 | - | 16 | 13 | 11 | 5.5 | 4.5 | 3.8 |
| Ken, E | 2 | 0.9 | 2 | 1 | 3 | 0.9 | 0.5 | 1.4 |
| Ken, W | 1 | 0.4 | 7 | 2 | 5 | 3.2 | 0.9 | 2.2 |
| La, E | 2 | 1.2 | 9 | 5 | 3 | 5.5 | 3 | 1.8 |
| La, M | 1 | 1.2 | 1 | 0 | 1 | 1.2 | - | 1.2 |
| La, W | 6 | 2.8 | 4 | 2 | 6 | 1.9 | 0.9 | 2.8 |
| Mass | 40 | 5.9 | 126 | 59 | 67 | 18.8 | 8.7 | 9.9 |
| Maryland | 17 | 2.8 | 18 | 22 | 50 | 3 | 3.7 | 8.4 |
| Maine | 0 | - | 6 | 4 | 0 | 4.5 | 3 | - |
| Mich, E | 33 | 5.1 | 80 | 79 | 49 | 12.4 | 12.3 | 7.6 |
| Mich, W | 6 | 1.7 | 19 | 10 | 17 | 5.5 | 2.9 | 4.9 |
| Minnesota | 19 | 3.5 | 62 | 56 | 54 | 11.4 | 10.3 | 9.9 |
| Mo, E | 12 | 4.1 | 22 | 9 | 15 | 7.5 | 3.1 | 5.1 |
| Mo, W | 6 | 1.9 | 12 | 8 | 10 | 3.8 | 2.6 | 3.2 |
| Miss, N | 0 | - | 2 | 2 | 0 | 1.8 | 1.8 | - |
| Miss, S | 1 | 0.5 | 4 | 6 | 2 | 2.1 | 3.2 | 1.1 |
| Montana | 1 | 1 | 6 | 0 | 2 | 5.9 | 2 | |
| N Car, E | 18 | 4.6 | 8 | 17 | 15 | 2.1 | 4.3 | 3.8 |
| N Car, M | 10 | 3.4 | 12 | 9 | 18 | 4.2 | 3.1 | 6.2 |
| N Car, W | 8 | 2.6 | 22 | 19 | 10 | 7.1 | 6.1 | 3.2 |
| N Dakota | 0 | - | 4 | 0 | 2 | 5.5 | 2.7 | |
| Nebraska | 4 | 2.1 | 8 | 3 | 5 | 4.3 | 1.6 | 2.7 |
| New Hamp | 1 | 0.8 | 15 | 8 | 6 | 11.3 | 6 | 4.5 |
| N. J. | 157 | 17.6 | 150 | 253 | 289 | 16.8 | 28.3 | 32.3 |
| N Mexico | 1 | 0.5 | 5 | 2 | 2 | 2.4 | 1 | 1 |
| Nevada | 36 | 12.7 | 45 | 41 | 22 | 16.1 | 14.4 | 7.7 |
| N. Y., E | 22 | 2.7 | 48 | 27 | 42 | 5.8 | 3.3 | 5.1 |
| N. Y., N | 4 | 1.2 | 18 | 11 | 7 | 5.2 | 3.2 | 2 |
| N. Y., S | 98 | 18.8 | 144 | 149 | 124 | 27.7 | 28.5 | 23.8 |
| N. Y., W | 13 | 4.6 | 25 | 19 | 12 | 8.9 | 6.7 | 4.3 |
| Ohio, N | 20 | 3.5 | 47 | 64 | 40 | 8.2 | 11.1 | 6.9 |
| Ohio, S | 14 | 2.4 | 34 | 26 | 15 | 5.9 | 4.5 | 2.6 |
| Okla, E | 0 | - | 1 | 1 | 0 | 1.3 | 1.3 | - |
| Okla, N | 0 | - | 8 | 6 | 2 | 7.7 | 5.7 | 1.9 |
| Okla, W | 5 | 2.4 | 2 | 5 | 1 | 1 | 2.4 | 0.5 |
| Oregon | 14 | 3.5 | 23 | 19 | 17 | 5.9 | 4.8 | 4.3 |
| Penn, E | 20 | 3.4 | 47 | 22 | 40 | 8.1 | 3.8 | 6.9 |
| Penn, M | 15 | 4.7 | 6 | 14 | 15 | 1.9 | 4.4 | 4.7 |
| Penn, W | 10 | 2.6 | 30 | 17 | 20 | 7.9 | 4.5 | 5.3 |
| Puerto Rico | 9 | na | 31 | 6 | 4 | na | na | na |
| R. I. | 2 | 1.9 | 8 | 1 | 4 | 7.6 | 0.9 | 3.8 |
| S Car | 5 | 1 | 10 | 12 | 6 | 2.1 | 2.5 | 1.2 |
| S Dakota | 0 | - | 3 | 0 | 1 | 3.5 | - | 1.2 |
| Tenn, E | 5 | 1.9 | 27 | 28 | 5 | 10.5 | 10.9 | 1.9 |
| Tenn, M | 5 | 2.1 | 17 | 14 | 3 | 7.2 | 5.8 | 1.3 |
| Tenn, W | 5 | 3.2 | 16 | 7 | 6 | 10.1 | 4.4 | 3.8 |
| Texas, E | 1380 | 364.8 | 1397 | 1620 | 2179 | 374.9 | 428.2 | 576 |
| Texas, N | 71 | 10.1 | 76 | 72 | 83 | 10.9 | 10.2 | 11.8 |
| Texas, S | 31 | 3.3 | 50 | 55 | 33 | 5.5 | 5.9 | 3.6 |
| Texas, W | 25 | 3.7 | 43 | 63 | 67 | 6.4 | 9.2 | 9.8 |
| Utah | 22 | 7.5 | 76 | 54 | 64 | 26.2 | 18.3 | 21.7 |
| Virg, E | 40 | 6.5 | 229 | 126 | 53 | 37.6 | 20.5 | 8.6 |
| Virg, W | 0 | - | 6 | 6 | 5 | 2.8 | 2.7 | 2.3 |
| Vermont | 1 | 1.6 | 4 | 4 | 1 | 6.4 | 6.4 | 1.6 |
| Wash, E | 1 | 0.6 | 0 | 4 | 2 | - | 2.6 | 1.3 |
| Wash, W | 20 | 3.6 | 52 | 41 | 65 | 9.6 | 7.4 | 11.8 |
| Wisc, E | 14 | 4.1 | 30 | 13 | 27 | 8.8 | 3.8 | 7.9 |
| Wisc, W | 4 | 1.7 | 24 | 34 | 22 | 10.2 | 14.4 | 9.3 |
| W Virg, N | 12 | 12.9 | 4 | 8 | 18 | 4.3 | 8.6 | 19.3 |
| W Virg, S | 1 | 1.1 | 1 | 2 | 1 | 1.1 | 2.2 | 1.1 |
| Wyoming | 0 | - | 1 | 1 | 0 | 1.7 | 1.7 | - |
Each month, TRAC offers a free report focused on one area of civil litigation in the U.S. district courts. In addition, subscribers to the TRACFed data service can generate custom reports by district, office, nature of suit or federal jurisdiction via the TRAC Data Interpreter.