Lawsuits for Recovery of Defaulted Student Loans
Have Fallen 24 Percent in Past Year
of Defaulted Student Loans
| Number Latest Month | 99 |
|---|---|
| Number Latest Quarter | 283 |
| Percent Change from 1 year ago | -24.0% |
| Percent Change from 5 years ago | -59.7% |
The latest available data from the federal courts show that during December 2015 the government reported 99 new civil filings in the nation's district courts for the recovery of defaulted student loans. According to the case-by-case information analyzed by the Transactional Records Access Clearinghouse (TRAC), there were a total of 283 such lawsuits filed during the first three months of FY 2016. (Note that these numbers exclude student loans to veterans.)
This continues the drop in student loan default lawsuits since reaching an annual peak of 4,333 filings during FY 2011 (see Figure 1).
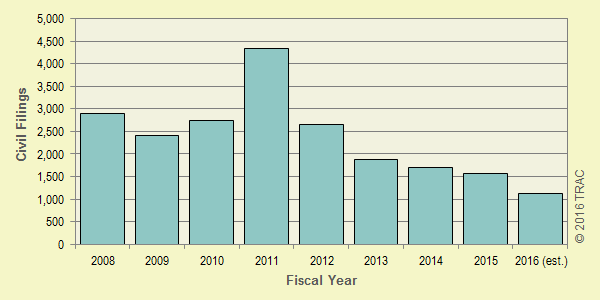
Figure 1. Annual Lawsuits for Recovery of Defaulted Student Loans, FY 2008 — FY 2016 (estimated)
When December 2015 civil filings of this type are compared with those of the same period in the previous year, their number is down 24.0 percent. And compared with the same period five years ago in December 2010, the decline is 59.7 percent.
The comparisons of the number of civil filings for recovery of defaulted student loans (excluding veterans) lawsuits are based on case-by-case court records which were compiled and analyzed by TRAC (see Table 1).
The month-to-month trend in filings for the recovery of defaulted student loans going back five years is shown more clearly in Figure 2. The vertical bars in Figure 2 represent the number of civil filings of this type recorded each month. The superimposed line on the bars plots the six-month moving average so that natural fluctuations are smoothed out. One-year and five-year change comparisons are based on the moving averages.
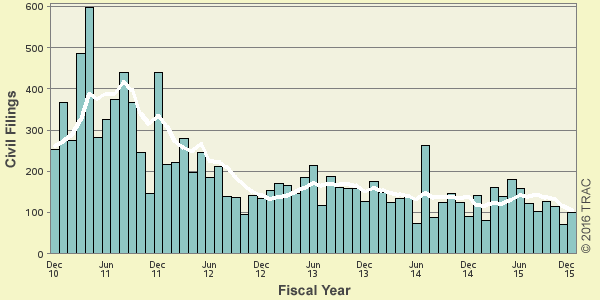
Figure 2. Monthly Lawsuits for Recovery of Defaulted Student Loans Over the Past 5 Years
Oct - Dec 2015 (click column header to sort)
| District | Number | Per Capita* |
|---|---|---|
| U.S. | 283 | 0.9 |
| Cal, C | 103 | 5.3 |
| Penn, E | 31 | 5.3 |
| Texas, N | 24 | 3.4 |
| Fla, S | 23 | 3.2 |
| Ill, N | 20 | 2.1 |
| N. Y., N | 9 | 2.6 |
| Penn, W | 8 | 2.1 |
| Mich, E | 8 | 1.2 |
| Texas, S | 8 | 0.9 |
| Cal, N | 6 | 0.7 |
| N. J. | 5 | 0.6 |
| D. C. | 4 | 6.1 |
| S Car | 3 | 0.6 |
| Wash, W | 3 | 0.5 |
| N. Y., W | 2 | 0.7 |
| N Car, W | 2 | 0.6 |
| Arizona | 2 | 0.3 |
| Ga, N | 2 | 0.3 |
| N. Y., E | 2 | 0.2 |
| Okla, E | 1 | 1.3 |
| La, M | 1 | 1.2 |
| Montana | 1 | 1 |
| Ga, S | 1 | 0.6 |
| Idaho | 1 | 0.6 |
| Tenn, W | 1 | 0.6 |
| Ga, M | 1 | 0.5 |
| Miss, S | 1 | 0.5 |
| Tenn, E | 1 | 0.4 |
| Cal, S | 1 | 0.3 |
| Conn | 1 | 0.3 |
| Mich, W | 1 | 0.3 |
| Mo, W | 1 | 0.3 |
| Colorado | 1 | 0.2 |
| Maryland | 1 | 0.2 |
| Ohio, S | 1 | 0.2 |
| Cal, E | 1 | 0.1 |
| Mass | 1 | 0.1 |
Top Ranked Judicial Districts
During the first three months of FY 2016, the Central District of California (Los Angeles) had the greatest number of filings — 103 suits, or 36 percent of the national total. Relative to its population, the Central District of California was tied for second place with the Eastern District of Pennsylvania, which saw a total of 31 such lawsuits.
First in the nation relative to population size was the District of Columbia. While it saw only 4 lawsuits during this same period, relative to its population it had six times the national average.
Other districts with particularly high numbers of student loan suits were the Northern District of Texas (Dallas) with 24, the Southern District of Florida (Miami) with 23, and the Northern District of Illinois (Chicago) with 20. Relative to their populations, these districts ranked fourth, fifth and seventh, respectively.
Coming in sixth place in per capita terms, the Northern District of New York with 9 student lawsuits ranked higher than Northern Illinois. New York North was also in sixth place in terms of the volume of lawsuits filed.
The federal judicial district which showed the greatest growth in the per capita number of defaulted student loan suits compared to one year ago was Northern District of Illinois. This district also had the highest increase when compared with five years ago.
Table 2 provides district-by-district details on the number and relative per capita size of their student loan suits during the first quarter of FY 2016. Click on a column header to sort the table by district, number of lawsuits, or per capita count.
Each month, TRAC offers a free report focused on one area of civil litigation in the U.S. district courts. In addition, subscribers to the TRACFed data service can generate custom reports by district, office, nature of suit or federal jurisdiction via the TRAC Data Interpreter.