Fair Labor Standards Act Lawsuits
Poised for Record High
Civil Filings
| Number Latest Month | 761 |
|---|---|
| Percent Change from 1 year ago | 14.7% |
| Percent Change from 5 years ago | 20.5% |
| Annual Counts | |
| FY 2008 | 5,416 |
| FY 2009 | 6,075 |
| FY 2010 | 6,919 |
| FY 2011 | 6,452 |
| FY 2012 | 8,296 |
| FY 2013 | 7,629 |
| FY 2014 | 8,343 |
| FY 2015 (projected) | 8,820 |
The government reported 761 new Fair Labor Standards Act (FLSA) civil filings during August 2015. If the pattern established during the current fiscal year continues through September, there will have been 8,820 such lawsuits filed in fiscal year 2015. This would be the largest number since employment levels tumbled after the 2008 financial crisis. This figure compares with 8,343 suits filed in FY 2014 and 7,629 during FY 2013 (see Table 1).
The FLSA established minimum wage, overtime pay, recordkeeping, and youth employment standards affecting employees in the private sector as well as in federal, state, and local governments. The comparisons of the number of civil filings for Fair Labor Standards Act related suits are based on case-by-case court records from the federal courts which were compiled and analyzed by the Transactional Records Access Clearinghouse (TRAC).
When monthly 2015 civil filings of this type are compared with those of the same period in the previous year, their number was up 14.7 percent. FLSA civil filings for August 2015 are higher than they were for the same period five years ago. Overall, the data show that civil filings of this type are up 20.5 percent from levels reported in August 2010.
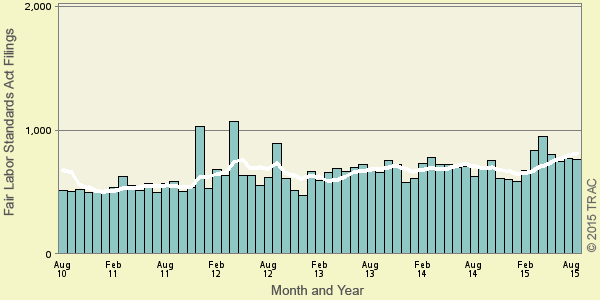
Figure 1. Fair Labor Standards Act Civil Filings Over the Past Five Years
The long term trend in Fair Labor Standards Act civil filings going back five years is shown more clearly in Figure 1. The vertical bars in Figure 1 represent the number of FLSA lawsuits recorded each month. The superimposed line on the bars plots the six-month moving average so that natural fluctuations are smoothed out. One-year and five-year change comparisons are based upon the moving averages.
Top Ranked Judicial Districts
(per One Million People)
| Judicial District |
Per Capita |
Count | Rank | 1yr ago |
5yrs ago |
|---|---|---|---|---|---|
| Fla, S | 18.3 | 127 | 1 | 1 | 1 |
| N. Y., S | 18.0 | 93 | 2 | 3 | 2 |
| D. C. | 11.1 | 7 | 3 | 2 | 21 |
| R. I. | 9.5 | 10 | 4 | - | 34 |
| Ala, N | 7.8 | 22 | 5 | 10 | 18 |
| N. Y., E | 7.4 | 60 | 6 | 4 | 7 |
| Texas, S | 6.6 | 59 | 7 | 8 | 10 |
| Fla, N | 6.2 | 11 | 8 | 5 | 8 |
| La, E | 4.9 | 8 | 9 | 33 | 44 |
| Fla, M | 4.7 | 50 | 10 | 6 | 3 |
Relative to population, the volume of civil matters of this type filed in federal district courts during August 2015 was 2.4 per every million persons in the United States. One year ago the relative number of filings was 2.0. Understandably, there is great variation in the per capita number of Fair Labor Standards Act civil filings in each of the nation's ninety-four federal judicial districts. Table 2 lists the ten most active districts for such cases in per capita terms during August 2015.
The Southern District of Florida — with 18.3 civil filings as compared with 2.4 civil filings per one million people in the United States — was the most active through August 2015. This same district was ranked first one and five years ago.
The Southern District of New York ranked second. It ranked third a year ago, while it was ranked second five years ago.
The District of Washington, D.C. now ranks third. It ranked second a year ago and was not in the top ten ranking five years ago.
A recent entry to the top 10 list was the Eastern District of Louisiana (New Orleans), now ranked ninth. This district ranked 33rd one year ago and 44th five years ago. It was the district that showed the greatest growth in such filings in the past year, with a 300 percent increase. Over a five-year period, Rhode Island had the largest increase of over 900 percent when it ranked 34th.
In the last year, the judicial District Court recording the largest drop in the rate of FLSA civil filings — 22.2 percent — was Washington, D.C. Over a five year span, the Middle District of Florida showed the largest drop — 34.0 percent.
Each month, TRAC offers a free report focused on one area of civil litigation in the U.S. district courts. In addition, subscribers to the TRACFed data service can generate custom reports by district, office, nature of suit or federal jurisdiction via the TRAC Data Interpreter.