Fewer Banking-Related Federal Civil Lawsuits
The latest available data from the federal courts show that during June 2015 the government reported 18 new "banks and banking" civil filings. According to the case-by-case court information analyzed by the Transactional Records Access Clearinghouse (TRAC) at Syracuse University, this number has been trending downward since new filings peaked at 79 in November of 2011.
If filings continue at the same pace during the remainder of this fiscal year, the total will only barely rise above 200 new suits for FY 2015 — the smallest number of such lawsuits filed since at least FY 2008 when there were 259 banking-related cases filed. After FY 2008, with the financial downturn, banking suits rose sharply: to 434 during FY 2009 and 641 during FY 2010. Then filings steadied to around 600 during the FY 2011 - FY 2012 period. Since then they have been falling steadily with 335 during FY 2013 and 301 during FY 2014.
The month-by-month trends over the past five years are shown more clearly in Figure 1. The vertical bars in Figure 1 represent the number of federal civil suits filed involving banks and banking each month. The superimposed line on the bars plots the six-month moving average so that natural fluctuations are smoothed out. These comparisons of the number of civil filings for banks and banking-related suits are based on case-by-case court records which were compiled and analyzed by TRAC.
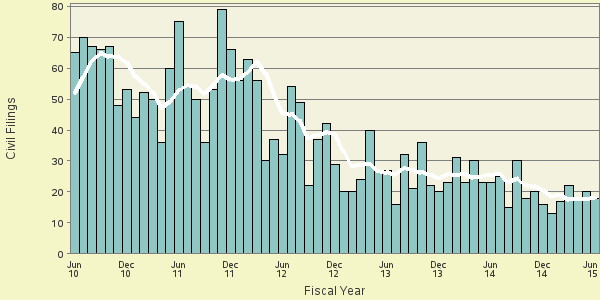
Figure 1. Banks and Banking Civil Filings over the last 5 years
Diverse Claims Involved in Banking Suits
These federal civil suits involve a range of disputes in the banking arena. Examples include alleged violations of a long list of federal statutes such as:
-
12 USC 85, 86 National Bank Act
-
12 USC 0632 International Banking
-
12 USC 1345 Financial Inst. Reform Recov. & Enforc. Act of 1989
-
12 USC 1725 Collection under Contract Guaranty
-
12 USC 1819 Default of Promissory Note
-
12 USC 1831 Depository Institution Employee Protection Remedy
-
12 USC 1831d Deposit. Inst. Dereg. & Monetary Ctrl. Act of 1980
-
12 USC 1821 Default of Loan by Promissory Note
-
12 USC 2609 Real Estate Settlement Procedures Act
-
12 USC 3751 Single Family Mortgage Foreclosure Act
-
12 USC 5211 Troubled Asset Relief Program ("TARP")
-
12 USC 1971 Relief under Bank Holding Act
-
15 USC 1601 Truth in Lending
-
15 USC 1693 Credit Card Accountability, Responsibility & Disclosure Act
-
15 USC 1692 Fair Debt Collection Act
-
15 USC 1693 Electronic Fund Transfers Act
-
18 USC 1962 Racketeering (RICO) Act
-
28 USC 1331 Fed. Question: Breach of Contract
-
28 USC 1332 Diversity-Fraud
-
28 USC 1345 Recovery of Debt to US
-
28 USC 1346 Breach of Contract
-
28 USC 1441 Notice of Removal
-
29 USC 1109 Breach of Fiduciary Duties
-
31 USC 3729 False Claims Act
-
31 USC 3731 Fraud
-
42 USC 1983 Civil Rights Act
Top Ranked Judicial Districts
Understandably, there is great variation in the number of banking-related civil filings in each of the nation's federal judicial districts during the FY 2008 to FY 2015 period. Across the nation, a total of 3,354 such suits were filed in federal district courts during this time frame. This amounted to about 1.4 suits annually for each million in population.
The Central District of California (Los Angeles) led the nation with 490 suits, accounting for roughly 15 percent of the total for the country. Relative to its population size, however, it ranked only fourth. In second place was the Southern District of Florida (Miami) with 130 suits, followed closely by the Southern District of New York (Manhattan) with 128 suits. Relative to their population, these two districts ranked somewhat lower at 8th and 6th place, respectively.
Taking population into consideration, the District of Columbia had the highest rate of banking filings. The Southern District of Georgia (Savannah) was in second place, and the Western District of Tennessee (Memphis) placed third. At the other extreme, North Dakota and the Eastern District of Oklahoma (Muskogee) did not record a single banking-related filing during this entire period.
Table 1 provides similar rankings for each federal judicial district on banking-related filings during the FY 2008 - FY 2015 period, current as of June 2015.
(click column header to sort)
| Federal District | Frequency | Rank | ||
|---|---|---|---|---|
| Number | Rate** | Number | Rate | |
| Entire U.S. | 3,354 | 1.4 | ||
| Cal, C | 490 | 3.3 | 1 | 4 |
| Fla, S | 130 | 2.4 | 2 | 8 |
| N. Y., S | 128 | 3.1 | 3 | 6 |
| Ga, N | 119 | 2.4 | 4 | 8 |
| Ill, N | 113 | 1.5 | 5 | 24 |
| Cal, N | 110 | 1.8 | 6 | 16 |
| Texas, S | 101 | 1.5 | 7 | 24 |
| Penn, E | 99 | 2.2 | 8 | 10 |
| Mich, E | 92 | 1.8 | 9 | 16 |
| Texas, N | 86 | 1.6 | 10 | 23 |
| N. Y., E | 84 | 1.3 | 11 | 30 |
| Fla, M | 79 | 0.9 | 12 | 42 |
| Wash, W | 77 | 1.8 | 13 | 16 |
| Cal, S | 72 | 2.7 | 14 | 7 |
| Maryland | 63 | 1.4 | 15 | 27 |
| Virg, E | 58 | 1.2 | 16 | 30 |
| D. C. | 55 | 11.2 | 17 | 1 |
| Utah | 49 | 2.2 | 18 | 10 |
| Mass | 49 | 0.9 | 18 | 42 |
| Ga, S | 48 | 4.0 | 20 | 2 |
| Texas, E | 48 | 1.7 | 20 | 19 |
| Ohio, N | 48 | 1.0 | 20 | 37 |
| Cal, E | 48 | 0.8 | 20 | 52 |
| N. J. | 48 | 0.7 | 20 | 57 |
| Nevada | 46 | 2.1 | 25 | 14 |
| Arizona | 46 | 0.9 | 25 | 42 |
| Tenn, W | 44 | 3.5 | 27 | 3 |
| Tenn, M | 40 | 2.2 | 28 | 10 |
| N Car, E | 33 | 1.1 | 29 | 34 |
| Minnesota | 33 | 0.8 | 29 | 52 |
| Ala, N | 31 | 1.4 | 31 | 27 |
| Miss, S | 30 | 2.0 | 32 | 15 |
| Ala, M | 29 | 3.2 | 33 | 5 |
| Colorado | 29 | 0.7 | 33 | 57 |
| Oregon | 28 | 0.9 | 35 | 42 |
| S Car | 28 | 0.8 | 35 | 52 |
| Texas, W | 25 | 0.5 | 37 | 65 |
| La, W | 23 | 1.3 | 38 | 30 |
| La, E | 22 | 1.7 | 39 | 19 |
| Mo, E | 22 | 0.9 | 39 | 42 |
| Penn, M | 22 | 0.9 | 39 | 42 |
| Mo, W | 20 | 0.8 | 42 | 52 |
| Ark, E | 19 | 1.5 | 43 | 24 |
| Ohio, S | 18 | 0.4 | 44 | 70 |
| Ken, W | 17 | 1.0 | 45 | 37 |
| W Virg, S | 16 | 2.2 | 46 | 10 |
| Okla, W | 16 | 1.0 | 46 | 37 |
| Miss, N | 15 | 1.7 | 48 | 19 |
| Fla, N | 15 | 1.1 | 48 | 34 |
| Ken, E | 15 | 0.9 | 48 | 42 |
| Wisc, E | 15 | 0.6 | 48 | 61 |
| Wash, E | 14 | 1.2 | 52 | 30 |
| Tenn, E | 14 | 0.7 | 52 | 57 |
| Conn | 14 | 0.5 | 52 | 65 |
| Penn, W | 14 | 0.5 | 52 | 65 |
| Ind, S | 14 | 0.4 | 52 | 70 |
| Nebraska | 13 | 0.9 | 57 | 42 |
| Kansas | 13 | 0.6 | 57 | 61 |
| N Car, W | 13 | 0.5 | 57 | 65 |
| Delaware | 12 | 1.7 | 60 | 19 |
| R. I. | 12 | 1.4 | 60 | 27 |
| Mich, W | 12 | 0.4 | 60 | 70 |
| Hawaii | 11 | 1.0 | 63 | 37 |
| Ga, M | 11 | 0.7 | 63 | 57 |
| N. Y., N | 10 | 0.4 | 65 | 70 |
| Ark, W | 9 | 0.9 | 66 | 42 |
| N. Y., W | 9 | 0.4 | 66 | 70 |
| W Virg, N | 8 | 1.1 | 68 | 34 |
| Okla, N | 8 | 1.0 | 68 | 37 |
| Ill, C | 8 | 0.4 | 68 | 70 |
| N Mexico | 7 | 0.4 | 71 | 70 |
| Virg, W | 7 | 0.4 | 71 | 70 |
| Ind, N | 7 | 0.3 | 71 | 83 |
| Ill, S | 6 | 0.6 | 74 | 61 |
| Idaho | 6 | 0.5 | 74 | 65 |
| N Car, M | 6 | 0.3 | 74 | 83 |
| La, M | 5 | 0.8 | 77 | 52 |
| Iowa, S | 5 | 0.4 | 77 | 70 |
| Wyoming | 4 | 0.9 | 79 | 42 |
| Ala, S | 4 | 0.6 | 79 | 61 |
| Iowa, N | 4 | 0.4 | 79 | 70 |
| Maine | 4 | 0.4 | 79 | 70 |
| New Hamp | 4 | 0.4 | 79 | 70 |
| Wisc, W | 3 | 0.2 | 84 | 87 |
| Alaska | 2 | 0.4 | 85 | 70 |
| Montana | 2 | 0.3 | 85 | 83 |
| S Dakota | 2 | 0.3 | 85 | 83 |
| Vermont | 1 | 0.2 | 88 | 87 |
| N Dakota | 0 | 0.0 | 89 | 89 |
| Okla, E | 0 | 0.0 | 89 | 89 |
Each month, TRAC offers a free report focused on one area of civil litigation in the U.S. district courts. In addition, subscribers to the TRACFed data service can generate custom reports by district, office, nature of suit or federal jurisdiction via the TRAC Data Interpreter.