Rise Seen in Education Civil Rights Lawsuits
The latest available data from the federal courts show that during May 2015 the government reported 49 new federal district court cases that were classified under the category of education civil rights. This brings to 337 the total number of such lawsuits filed during the first eight months of fiscal year 2015.
These suits involve a range of alleged civil rights violations in the educational arena. Examples include alleged violations of IDEA (the Individuals with Disabilities Education Act) or the Handicapped Child Act under Title 20 Sections 1400 and 1401 of the U.S. Code, job discrimination under 29 USC 794, discrimination in federal-funded educational programs under Title 20, Section 1681 of the U.S. Code, racial discrimination under 42 USC 1982, violation of Title 42 Section 1983 of the Civil Rights Act, violation of the Americans with Disabilities Act of 1990 (42 USC 12101), sex discrimination under Title IX (20 USC 1681) as well as other civil rights issues under Title 28 Section 1343.
If filings continue at the same pace during the remainder of the year, the total could exceed 500 cases — the largest number of such cases since the beginning of FY 2012 when courts began tracking this category with a distinct nature of suit code. Last year there were 455 such lawsuits, and during FY 2013 there were 290.
The steadily rising number of lawsuits over this period is shown more clearly in Figure 1. The vertical bars in Figure 1 represent the number of education civil rights filings recorded each month. The superimposed line on the bars plots the six-month moving average so that natural fluctuations are smoothed out. These findings are based upon case-by-case court records that were compiled and analyzed by the Transactional Records Access Clearinghouse (TRAC) at Syracuse University.
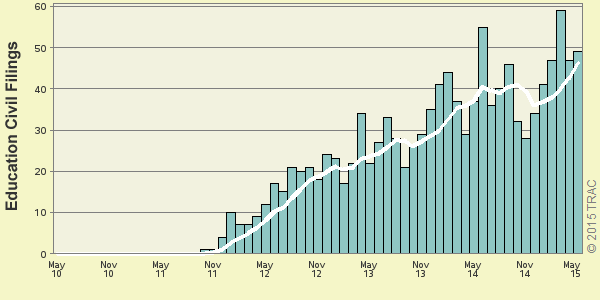
Figure 1. Education Civil Filings Since Fiscal Year 2012
Top Ranked Judicial Districts
Understandably, there is great variation in the number of education civil filings in each of the nation's ninety-four federal judicial districts. Thus far during FY 2015, the Southern District of New York (Manhattan) led the nation with 38 such lawsuits. The Eastern District of Pennsylvania (Philadelphia) with a total of 24 had the second largest number, closely followed by New Jersey with 23.
If the FY 2012 - FY 2015 (through May) combined period is compared, then New Jersey with a total of 86 such suits heads the list. The Eastern District of Pennsylvania (Philadelphia) was again in second place with 72, followed by the District of Columbia with 59.
Table 1 provides similar details for each federal judicial district that recorded at least one civil rights suit in the education area since FY 2012.
(click column header to sort)
| Federal District | Number FY 2015* | FY 2012 - FY 2015* | |
|---|---|---|---|
| Number | Rate** | ||
| Entire U.S. | 337 | 1206 | 1.1 |
| Ala, M | 2 | 10 | 1.1 |
| Ala, S | 0 | 4 | 0.6 |
| Alaska | 1 | 1 | 0.2 |
| Arizona | 3 | 9 | 0.2 |
| Ark, E | 0 | 3 | 0.2 |
| Ark, W | 1 | 2 | 0.2 |
| Cal, C | 8 | 51 | 0.3 |
| Cal, E | 1 | 19 | 0.3 |
| Cal, N | 3 | 32 | 0.5 |
| Cal, S | 2 | 7 | 0.3 |
| Colorado | 2 | 18 | 0.4 |
| Conn | 4 | 23 | 0.8 |
| D. C. | 19 | 59 | 12 |
| Delaware | 1 | 3 | 0.4 |
| Fla, M | 4 | 12 | 0.1 |
| Fla, N | 2 | 10 | 0.7 |
| Fla, S | 2 | 10 | 0.2 |
| Ga, M | 8 | 14 | 0.9 |
| Ga, N | 4 | 10 | 0.2 |
| Ga, S | 0 | 4 | 0.3 |
| Hawaii | 5 | 14 | 1.3 |
| Idaho | 1 | 5 | 0.4 |
| Ill, C | 5 | 12 | 0.7 |
| Ill, N | 4 | 31 | 0.4 |
| Ill, S | 2 | 4 | 0.4 |
| Ind, N | 2 | 2 | 0.1 |
| Ind, S | 12 | 0.4 | |
| Iowa, S | 1 | 3 | 0.2 |
| Kansas | 1 | 7 | 0.3 |
| Ken, E | 2 | 12 | 0.7 |
| Ken, W | 5 | 10 | 0.6 |
| La, E | 1 | 7 | 0.5 |
| La, M | 4 | 1 | 0.2 |
| La, W | 0 | 7 | 0.4 |
| Maine | 3 | 17 | 1.6 |
| Maryland | 4 | 27 | 0.6 |
| Mass | 8 | 35 | 0.7 |
| Mich, E | 4 | 16 | 0.3 |
| Mich, W | 5 | 9 | 0.3 |
| Minnesota | 6 | 23 | 0.5 |
| Miss, N | 0 | 9 | 1.0 |
| Miss, S | 1 | 4 | 0.3 |
| Mo, E | 1 | 7 | 0.3 |
| Mo, W | 5 | 11 | 0.4 |
| Montana | 0 | 9 | 1.1 |
| N Car, E | 0 | 3 | 0.1 |
| N Car, M | 3 | 6 | 0.3 |
| N Car, W | 3 | 9 | 0.4 |
| N Mexico | 2 | 8 | 0.5 |
| N. J. | 23 | 86 | 1.2 |
| N. Y., E | 18 | 54 | 0.8 |
| N. Y., N | 5 | 11 | 0.4 |
| N. Y., S | 38 | 52 | 1.3 |
| N. Y., W | 2 | 12 | 0.5 |
| Nebraska | 0 | 1 | 0.1 |
| New Hamp | 1 | 1 | 0.1 |
| Ohio, N | 3 | 24 | 0.5 |
| Ohio, S | 3 | 14 | 0.3 |
| Okla, E | 1 | 3 | 0.5 |
| Okla, N | 3 | 5 | 0.6 |
| Okla, W | 1 | 3 | 0.2 |
| Oregon | 3 | 17 | 0.6 |
| Penn, E | 24 | 72 | 1.6 |
| Penn, M | 6 | 24 | 1 |
| Penn, W | 3 | 21 | 0.7 |
| Puer Rico | 13 | 26 | na |
| R. I. | 0 | 3 | 0.4 |
| S Car | 4 | 9 | 0.2 |
| S Dakota | 0 | 1 | 0.2 |
| Tenn, E | 1 | 8 | 0.4 |
| Tenn, M | 6 | 11 | 0.6 |
| Tenn, W | 0 | 8 | 0.6 |
| Texas, E | 3 | 9 | 0.3 |
| Texas, N | 1 | 11 | 0.2 |
| Texas, S | 12 | 27 | 0.4 |
| Texas, W | 1 | 9 | 0.2 |
| Utah | 0 | 1 | 0 |
| Vermont | 1 | 3 | 0.6 |
| Virg, E | 2 | 7 | 0.1 |
| Virg, W | 1 | 1 | 0.1 |
| W Virg, S | 1 | 4 | 0.5 |
| Wash, E | 1 | 4 | 0.3 |
| Wash, W | 9 | 29 | 0.7 |
| Wisc, E | 1 | 8 | 0.3 |
| Wisc, W | 0 | 4 | 0.2 |
| Wyoming | 1 | 2 | 0.4 |
Each month, TRAC offers a free report focused on one area of civil litigation in the U.S. district courts. In addition, subscribers to the TRACFed data service can generate custom reports by district, office, nature of suit or federal jurisdiction via the TRAC Data Interpreter.