DuPont C8 Cases Contribute to Spike in
Non-Product Liability Personal Injury Lawsuits
Number Latest Month 1,944 Percent Change from previous month 13.4% Percent Change from 1 year ago 21.1% Percent Change from 5 years ago 12.9%
Table 1. Personal Injury Civil Filings
(non-Product Liability)The latest available data from the federal courts show that during August 2014 the government reported 1,944 new personal injury civil filings which were not related to product liability. Those cases had the nature of suit classified by the court system under "Torts - Personal Injury - Other." According to the case-by-case information analyzed by the Transactional Records Access Clearinghouse (TRAC), this number is up 13.4 percent over the previous month when the number of civil filings of this type totaled 1,715.
The comparisons of the number of civil filings are based on case-by-case court records which were compiled and analyzed by TRAC (see Table 1).
Much of the observed increase appears to be due to cases filed against DuPont over air and water contamination by C8, a chemical used in the manufacture of Teflon. These suits are part of multi-district litigation MDL-2433 assigned to District Judge Edmund A. Sargus, Jr. in the Southern District of Ohio.
When monthly 2014 civil filings of this type are compared with those of the same period in the previous year, their number was up 21.1 percent. Civil filings for August 2014 are higher than they were for the same period five years ago. Overall, the data show that civil filings of this type are up 12.9 percent from levels reported in August 2009.
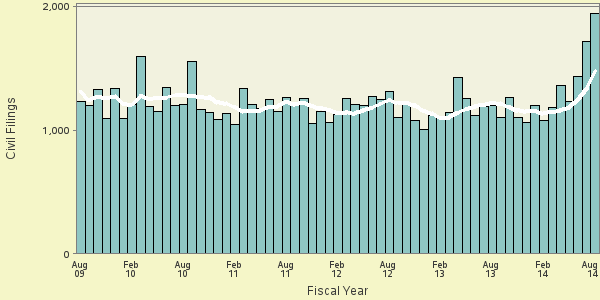
The long term trend in civil filings for these matters going back five years is shown more clearly in Figure 1. The vertical bars in Figure 1 represent the number of civil filings of this type recorded each month. The superimposed line on the bars plots the six-month moving average so that natural fluctuations are smoothed out. One-year and five-year change comparisons are based upon the moving averages.
Rankings: Specific Nature of Suit
Court filings can be classified based upon the specific nature of the suit. Table 2 shows the top nature of suit categories recorded in these matters filed during August 2014. The greatest growth occurred in the "Other Personal Injury" category, which comprised two out of three (67.6%) of all non-product liability personal injury suits in August 2014.
The most frequently cited cause of action for lawsuits in this group was 28 USC 1332 concerning jurisdiction of the district courts based on diversity of citizenship, amount in controversy, and costs; this statute was cited in over half (58 percent) of such cases. The second most common cause of action was 28 USC 1441 which concerns the removability of cases from state courts, with 12 percent.
"Other Personal Injury" was the most frequently recorded nature of suit category, as it was one and five years ago.
Ranked second in frequency was the nature of suit category "Motor Vehicle" which was also ranked second last year and five years ago.
Ranked third was "Marine". It was the third most frequently invoked nature of suit one and five years ago.
Among these top nature of suit categories, the one showing the greatest increase in civil filings — up 113.5 percent — compared to one year ago was "Other Personal Injury". This was the same category that had the largest increase — 133.2 percent — when compared with five years ago.
Again among the top ten nature of suit categories, the one showing the sharpest decline in civil filings compared to one year ago — down 16.7 percent — was "Assault, Libel, & Slander". This was the same statute that had the largest decrease — 72.1 percent — when compared with five years ago.
Top Ranked Judicial Districts
Relative to population, the volume of civil matters of this type filed in federal district courts during August 2014 was 6.2 per every million persons in the United States. One year ago the relative number of filings was 3.8. Understandably, there is great variation in the per capita number of civil filings in each of the nation's ninety-four federal judicial districts. Table 2 lists the ten most active districts for such cases in per capita terms in August 2014.
Judicial District Percapita Count Rank 1yr ago 5yrs ago W Virg, S 252.8 235 1 46 6 N. Y., S 46.7 241 2 14 10 Ohio, S 42.0 243 3 82 77 La, E 39.9 65 4 1 1 La, W 27.3 59 5 7 5 D. C. 23.7 15 6 17 2 La, M 18.4 15 7 2 4 Penn, E 11.0 64 8 4 12 Fla, S 10.5 73 9 6 3 Miss, S 9.6 18 10 5 7
Table 3. Top Ten Districts (per One Million People)
The Southern District of West Virginia — with 252.8 civil filings as compared with 6.2 civil filings per one million people in the United States — was the most active through August 2014.
The Southern District of New York ranked second.
The Southern District of Ohio now ranks third.
Recent entries to the top 10 list were the Southern District of New York (Manhattan), Washington, D.C. (Washington), the Southern District of West Virginia (Charleston) and the Southern District of Ohio (Cincinnati).
The federal judicial district which showed the greatest growth in the rate of civil filings compared to one year ago — 7730 percent — was the Southern District of West Virginia. Compared to five years ago, the district with the largest growth — 2900 percent — was the Southern District of Ohio.
In the last year, the judicial District Court recording the largest drop in the rate of civil filings — 14.3 percent — was the Southern District of Mississippi. But over the past five years, the Southern District of Florida showed the largest drop — 44.3 percent.
Each month, TRAC offers a free report focused on one area of civil litigation in the U.S. district courts. In addition, subscribers to the TRACFed data service can generate custom reports by district, office, nature of suit or federal jurisdiction via the TRAC Data Interpreter.
Report Date: October 6, 2014