Decline in Federal Employment Lawsuits
Number Latest Month 862 Number Previous Month 838 Percent Change from 1 year ago -15.1% Percent Change from 5 years ago -12.9%
Table 1. Employment Civil FilingsThe monthly average number of federal employment lawsuits has dropped below 1,000 for the first five months of FY 2014. This is the first fiscal year for which this average has dipped below 1,000 since the start of TRAC's statistics on federal civil court filings in FY 2006.
The latest available data from the federal courts show that during February 2014 the government reported 862 new employment civil filings; during January 2014 such filings totaled 838. The number of employment lawsuits has been generally falling since reaching a high point during FY 2010 and FY 2011; it is currently 15.1 percent lower than it was a year ago and 12.9 percent lower than it was in February 2009.
The comparisons of the number of civil filings for employment-related suits are based on case-by-case court records which were compiled and analyzed by TRAC (see Table 1).
Various federal statutes are invoked as the cause of action in employment lawsuits. These include: sex, race, age and other types of job discrimination including retaliatory practices under 42 USC 2000 and 2000e; violations of the Americans with Disabilities Act (42 USC 12101 and 12117); the Fair Labor Standards Act (29 USC 201); job discrimination related to rehabilitation and handicaps (29 USC 791 and 794); the Family and Medical Leave Act (29 USC 2601); and the Uniformed Services Employment and Reemployment Rights Act (38 USC 4301-4335).
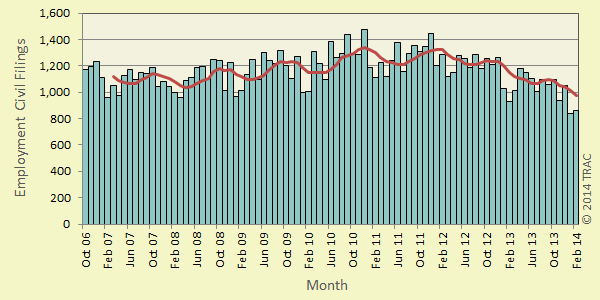
Figure 1. Employment Civil Filings Over TimeThe long term trend in employment civil filings is shown more clearly in Figure 1. The vertical bars in Figure 1 represent the number of employment civil filings recorded each month. The superimposed line on the bars plots the six-month moving average so that natural fluctuations are smoothed out. One-year and five-year change comparisons are based upon the moving averages.
Top Ranked Judicial Districts
Relative to population, the volume of civil matters of this type filed in federal district courts during February 2014 was 2.7 per every million persons in the United States. One year ago the relative number of filings was 3.0. Understandably, there is great variation in the per capita number of employment civil filings in each of the nation's ninety-four federal judicial districts.
Judicial District Percapita Count Rank 1yr ago 5yrs ago D. C. 23.7 15 1 1 1 Fla, N 11.8 21 2 3 16 Penn, E 8.3 48 3 8 12 N. Y., S 7.8 40 4 4 4 Nevada 7.2 20 5 26 26 Ala, N 7.0 20 6 2 2 Ala, M 7.0 8 7 20 6 Tenn, W 6.3 10 8 15 3 Ark, E 6.1 10 9 21 10 Hawaii 5.7 8 10 30 71
Table 2. Top 10 Districts (per One Million People)
The District of Washington, D.C. — with 23.7 civil filings as compared with 2.7 civil filings per one million people in the United States — was the most active through February 2014. The District of Washington, D.C. was ranked first a year ago as well as five years ago.
The Northern District of Florida ranked second. The Northern District of Florida was ranked third a year ago.
The Eastern District of Pennsylvania now ranks third. The Eastern District of Pennsylvania was ranked eighth a year ago.
The federal judicial district which showed the greatest growth in the rate of employment civil filings compared to one year ago — 81.8 percent — was Nevada. Compared to five years ago, the district with the largest growth — 272.1 percent — was Hawaii.
In the last year, the judicial District Court recording the largest drop in the rate of employment civil filings — 31.0 percent — was the Northern District of Alabama. But over the past five years, the Western District of Tennessee showed the largest drop — 48.3 percent.
Each month, TRAC offers a free report focused on one area of civil litigation in the U.S. district courts. In addition, subscribers to the TRACFed data service can generate custom reports by district, office, nature of suit or federal jurisdiction via the TRAC Data Interpreter.
Report Date: March 26, 2014
