Decline Seen in Consumer Credit Civil Lawsuits
Number Latest Month 586 Percent Change from previous month -12.0% Percent Change from 1 year ago -12.9% Percent Change from 5 years ago 66.6%
Table 1. Consumer Credit Civil FilingsIn November 2013 the federal government reported 586 new consumer credit civil filings, the lowest number of such lawsuits since May 2009. According to the case-by-case information analyzed by the Transactional Records Access Clearinghouse (TRAC), this is 12 percent fewer than the previous month's count of 666. The most recent number is also 37 percent lower than in April 2013, when the monthly count spiked to 930 filings.
The comparisons of the number of civil filings for consumer credit-related suits are based on case-by-case court records which were compiled and analyzed by TRAC (see Table 1)
Consumer credit lawsuits involve alleged violations any one of a number of statutes, the most common being the Fair Debt Collection Act (15 USC 1692) and the Fair Credit Reporting Act (15 USC 1681). Among other statutes cited in these suits are Truth in Lending (15 USC 1601, 15 USC 1640), the Telephone Consumer Protection Act (47 USC 227), the Electronic Fund Transfer Act (15 USC 1693), the Equal Credit Opportunity Act (15 USC 1691), and Fraud - Motor Vehicles (15 USC 1981).
While the number of consumer credit lawsuits has fallen this past year, it is still substantially higher — 66.6 percent — than it was five years ago. Indeed, as shown in Figure 1, such lawsuits rose steadily from that point until peaking in August 2011.
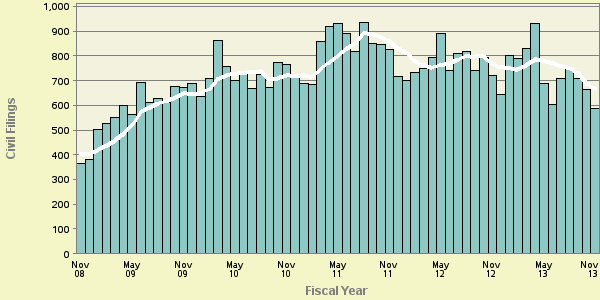
Figure 1. Consumer Credit Civil Filings over the Last 5 YearsThe vertical bars in Figure 1 represent the number of consumer credit civil filings recorded each month. The superimposed line on the bars plots the six-month moving average so that natural fluctuations are smoothed out. One-year and five-year change comparisons are based upon the moving averages. (Last June, TRAC reported on the separate declines in lawsuits under Truth in Lending provisions. However, the pattern of those declines has been quite different than those for consumer credit more generally shown here.)
Top Ranked Judicial Districts
Relative to population, the volume of civil matters of this type filed in federal district courts during November 2013 was 1.9 per every million persons in the United States. One year ago the relative number of filings was 2.3. Understandably, there is great variation in the per capita number of consumer credit civil filings in each of the nation's ninety-four federal judicial districts.
Judicial District Percapita Count Rank 1yr ago 5yrs ago N. Y., W 6.4 18 1 2 7 Nevada 5.8 16 2 7 16 Minnesota 5.8 31 3 3 31 Ill, S 5.5 7 4 38 38 Colorado 5.2 27 5 1 4 Fla, S 4.9 34 6 29 18 W Virg, S 4.3 4 7 31 3 N. Y., E 4.2 34 8 5 12 Ill, N 3.5 33 9 13 8 Mich, W 3.5 12 10 34 9
Table 2. Top 10 Districts (per One Million People)
The Western District of New York — with 6.4 civil filings as compared with 1.9 civil filings per one million people in the United States — was the most active through November 2013. The Western District of New York was ranked second a year ago, while it was ranked seventh five years ago.
The District of Nevada ranked second, rising in rank from seventh a year ago.
The District of Minnesota now ranks third and also ranked third a year ago.
The federal judicial district which showed the greatest growth in the rate of consumer credit civil filings compared to one year ago — 250.0 percent — was the Southern District of Illinois. This was the same district that had the largest increase — 595.3 percent — when compared with five years ago.
In the last year, the judicial District Court recording the largest drop in the rate of consumer credit civil filings — 48.1 percent — was Colorado. But over the past five years, the Southern District of West Virginia showed the largest drop — 20.5 percent.
Each month, TRAC offers a free report focused on one area of civil litigation in the U.S. district courts. In addition, subscribers to the TRACFed data service can generate custom reports by district, office, nature of suit or federal jurisdiction via the TRAC Data Interpreter.
Report Date: January 6, 2014
