Decline in Drug-Related Seizure of Property
Civil Filings for July 2013
Number Latest Month 92 Percent Change from previous month -2.1% Percent Change from 1 year ago -8.2% Percent Change from 5 years ago -20.8%
Table 1. Drug-Related Seizure of Property
Civil Filings under 21 USC 881The latest available civil data from the federal courts show that during July 2013 the government reported 92 new filings for the drug-related seizure of property under 21 USC 881. As part of the Department of Justice (DOJ) Asset Forfeiture Program, such suits are employed when DOJ components seize assets that "represent the proceeds of, or were used to facilitate federal crimes." In the court's nature of suit record-keeping system, these cases were classified "forfeiture/penalty."
According to the case-by-case information analyzed by the Transactional Records Access Clearinghouse (TRAC), the very recent July number of civil filings for drug-related seizures over time is down 2.1 percent over the previous month, when the number of civil filings of this type totaled 94.
When the monthly count of 2013 civil filings of this type are compared with those of the same period in the previous year, they were down 8.2 percent. Such filings for July 2013 also were lower than in the same period five years ago. Overall, the data show that civil filings of this type are down 20.8 percent from levels reported in July 2008 (see Table 1).
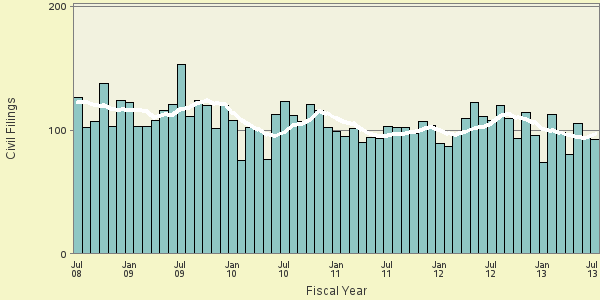
Figure 1. Drug-Related Seizure of Property Civil Filings over the Last 5 YearsThe long term trend in drug-related seizure of property civil filings going back five years is shown more clearly in Figure 1. The vertical bars in Figure 1 represent the number of such lawsuits recorded each month. The superimposed line on the bars plots the six-month moving average so that natural fluctuations are smoothed out. One-year and five-year change comparisons are based upon the moving averages.
It should be emphasized that these counts are only for seizures by federal agencies and do not cover the increasing use of such laws by state and local enforcement authorities. While the forfeiture of assets in colonial America by the British was unpopular and became a factor in the American revolution, the first Congress passed a forfeiture law mostly aimed at customs violators. The program rapidly expanded in a series of new laws approved by Congress, beginning during the "War on Drugs" campaigns of the 1970s. And according to the GAO, annual revenues from forfeited assets jumped from $500 million in 2003 to $1.8 billion in 2011.
Top Ranked Judicial Districts
Judicial District Count Rank 1yr ago 5yrs ago Cal, E 9 1 6 18 Ohio, N 6 2 6 11 N. Y., W 5 3 6 5 Maryland 5 3 3 11 N Mexico 4 5 1 - Nevada 4 5 - - Texas, W 4 5 18 2 Ga, N 4 5 29 4 Conn 3 9 29 - N Car, E 3 9 4 18 Texas, S 3 9 18 18
Table 2. Top 10 Districts
Understandably, there is great variation in the number of drug-related seizure of property lawsuits in each of the nation's ninety-four federal judicial districts.
The Eastern District of California — with 9 civil filings — was the most active through July 2013. The Eastern District of California was ranked 6th a year ago.
The Northern District of Ohio ranked 2nd. The Northern District of Ohio was ranked 6th a year ago.
The Western District of New York and the District of Maryland now rank 3rd. The Western District of New York was ranked 6th a year ago, while it was ranked 5th five years ago. The District of Maryland was ranked 3rd a year ago.
The federal judicial district which showed the greatest growth in drug-related seizure of property civil filings compared to one year ago — 300 percent — was the Northern District of Georgia. Compared to five years ago, the district with the largest growth — 350 percent — was the Eastern District of California.
In the last year, the judicial District Court recording the largest drop in drug-related seizure of property civil filings — 60 percent — was New Mexico. But over the past five years, the Western District of Texas showed the largest drop — 42.9 percent.
Each month, TRAC offers a free report focused on one area of civil litigation in the U.S. district courts. In addition, subscribers to the TRACFed data service can generate custom reports by district, office, nature of suit or federal jurisdiction via the TRAC Data Interpreter.
Report Date: August 22, 2013
