White Collar Crime Convictions for October 2015
The latest available data from the Justice Department show that during October 2015 the government reported 566 new white collar crime convictions. According to the case-by-case information analyzed by the Transactional Records Access Clearinghouse (TRAC), this number is down 23.2 percent over the previous month.
White Collar Crime
This report summarizes the government's recent efforts when it comes to combating white collar crime — the number of such cases, the investigative agencies involved, the laws cited, the busiest federal districts and the busiest federal judges.
See more...The comparisons of the number of defendants convicted for white collar crime-related offenses are based on case-by-case information obtained by TRAC under the Freedom of Information Act from the Executive Office for United States Attorneys (see Table 1).
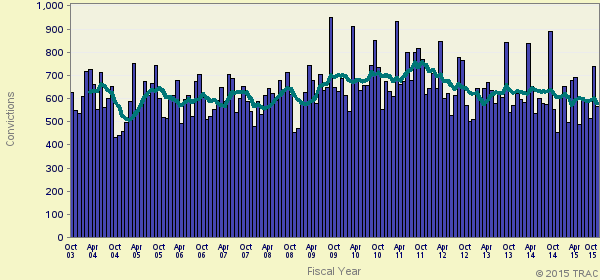
When monthly 2015 convictions of this type are compared with those of the same period in the previous year, the number of convictions was down (-6.7%). Convictions over the past year are still much lower than they were five years ago. Overall, the data show that convictions of this type are down 18.5 percent from levels reported in 2010.
The dip in these cases is partly related to increases in the matters filed in U.S. Magistrate Courts. If magistrate cases are excluded and only Federal District Court cases are counted, the overall decrease in white collar crime convictions is 8.7 percent instead of 18.5 percent. The evidence suggests that part of the difference may be the result of improvements in the recording of the magistrate cases by the Justice Department.
The decrease from the levels five years ago in white collar crime convictions for these matters is shown more clearly in Figure 1. The vertical bars in Figure 1 represent the number of white collar crime convictions of this type recorded on a month-to-month basis. Where a prosecution was initially filed in U.S. Magistrate Court and then transferred to the U.S. District Court, the magistrate filing date was used since this provides an earlier indicator of actual trends. The superimposed line on the bars plots the six-month moving average so that natural fluctuations are smoothed out. The one and five-year rates of change in Table 1 and in the sections that follow are all based upon this six-month moving average. To view trends year-by-year rather than month-by-month, see TRAC's annual report series for a broader picture.
Within the broad category of white collar crime, cases were classified by prosecutors into more specific types.
Case types within white collar crime are
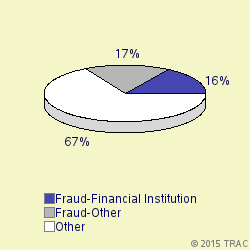
• Federal Procurement Fraud • Federal Program Fraud • Tax Fraud • Arson for Profit • Other Insurance Fraud • Financial Institution Fraud • Bankruptcy Fraud • Advance Fee Schemes • Other Fraud Against Businesses • Consumer Fraud • Securities Fraud • Commodities Fraud • Other Investment Fraud • Antitrust Violations - Other • Computer Fraud • Health Care Fraud • Fraud Against Insurance Providers • Intellectual Property Violations • Insider Fraud Against Insurance Providers • MEWA (Multiple Employer Welfare Arrangements) Fraud/MET • Antitrust Violations - Airlines • Antitrust Violations - Banking • Antitrust Violations - Defense Procurement • Antitrust Violations - Extraterritorial Application Of • Antitrust Violations - Finance Markets, Other than Banking • Telemarketing Fraud • Corporate Fraud • Identity Theft • Aggravated Identity Theft • Other White Collar Crime/Fraud The largest number of convictions of these matters in October 2015 was for "Fraud-Other", accounting for 17.1 percent of convictions. Convictions were also filed for "Fraud-Financial Institution" (16.1%), "Fraud-Tax" (13.3%), " Fraud-Federal Program" (12.5%), "Fraud-Health Care" (7.4%), "Fraud-Identity Theft-Aggravated" (6.5%), "Fraud-Other Business" (5.7%), "Fraud-Mortgage" (5.1%), "Fraud-Identity Theft-Other" (3.7%). See Figure 2.
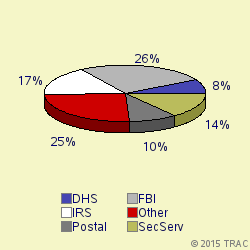
The lead investigative agency for white collar crime convictions in October 2015 was FBI accounting for 26 percent of convictions. Other agencies with substantial numbers of white collar crime convictions were: IRS (17% ), SecServ (14%), Postal (10%), DHS (8%). See Figure 3.
White Collar Crime Convictions in U.S. Magistrate Courts
Top Ranked Lead Charges
In October 2015, 7 defendants in white collar crime cases for these matters were filed in U.S. Magistrate Courts. These courts handle less serious misdemeanor cases, including what are called "petty offenses." In addition, complaints are sometimes filed in the magistrate courts before an indictment or information is entered. In these cases, the matter starts in the magistrate courts and later moves to the district court where subsequent proceedings take place.
In the magistrate courts in October the most frequently cited lead charge was Title 18 U.S.C Section 1028 involving "Aggravated Identity Theft". This was the lead charge for 71.4 percent of all magistrate convictions in October.
White Collar Crime Convictions in U.S. District Courts
In October 2015, 559 defendants in new cases for these matters were charged in the U.S. District Courts. In addition during October there were an additional 0 defendants whose cases moved from the magistrate courts to the U.S. district courts after an indictment or information was filed. The sections which follow cover both sets of cases and therefore cover all matters filed in district court during October.
Top Ranked Lead Charges
Table 2 shows the top lead charges recorded in the convictions of white collar crime matters filed in U.S. District Court during October 2015.
Lead Charge Count Rank 1yr ago 5yrs ago 18 USC 1343 - Fraud by wire, radio, or television 70 1 1 3 More 18 USC 1344 - Bank Fraud 60 2 2 1 More 18 USC 1341 - Mail Fraud - Frauds and swindles 51 3 3 2 More 18 USC 641 - Public money, property or records 39 4 4 7 More 18 USC 1349 - Mail Fraud - Attempt and Conspiracy 34 5 6 10 More 18 USC 371 - Conspiracy to commit offense or to defraud US 31 6 5 4 More 18 USC 1028 - Fraud and related activity - id documents 27 7 7 5 More 18 USC 1029 - Fraud and related activity - access devices 27 7 8 6 More 18 USC 286 - Conspiracy to defraud the Government claims 20 9 12 19 More 26 USC 7201 - Attempt to evade or defeat tax 19 10 11 9 More Table 2. Top Charges for Convictions
"Fraud by wire, radio, or television" (Title 18 U.S.C Section 1343) was the most frequent recorded lead charge. "Fraud by wire, radio, or television" (Title 18 U.S.C Section 1343) was ranked 1 a year ago, while it was ranked 3 five years ago.
Ranked 2nd in frequency was the lead charge "Bank Fraud" under Title 18 U.S.C Section 1344. "Bank Fraud" under Title 18 U.S.C Section 1344 was ranked 2 a year ago, while it was ranked 1 five years ago.
Ranked 3rd was "Mail Fraud - Frauds and swindles" under Title 18 U.S.C Section 1341. "Mail Fraud - Frauds and swindles" under Title 18 U.S.C Section 1341 was ranked 3 a year ago, while it was ranked 2 five years ago.
Among these top ten lead charges, the one showing the greatest increase in convictions — up 11.5 percent — compared to one year ago was Title 18 U.S.C Section 286 that involves " Conspiracy to defraud the Government claims ". This was the same statute that had the largest increase — 193.9 % — when compared with five years ago.
Again among the top ten lead charges, the one showing the sharpest decline in convictions compared to one year ago — down 23.9 percent — was " Fraud and related activity - id documents " (Title 18 U.S.C Section 1028 ). Compared to five years ago, the most significant decline in convictions — 41.1 percent — was for convictions where the lead charge was " Attempt to evade or defeat tax " (Title 26 U.S.C Section 7201 ).
Top Ranked Judicial Districts
In October 2015 the Justice Department said the government obtained 210.4 white collar crime convictions for every ten million people in the United States.
Understandably, there is great variation in the per capita number of white collar crime convictions in each of the nation's ninety-four federal judicial districts.
The districts registering the largest number of convictions per capita for these matters last month are shown in Table 3. Districts must have at least 5 white collar crime convictions to receive a ranking.
Judicial District Percapita Count Rank 1yr ago 5yrs ago Utah 1,101 27 1 34 20 More N Car, W 576 15 2 21 50 More Ill, S 566 6 3 47 56 More Fla, S 538 32 4 1 1 More Mo, E 532 13 5 13 15 More Miss, S 512 8 6 17 14 More Ill, C 481 9 7 47 66 More Maine 451 5 8 83 90 More Nebraska 446 7 9 42 56 More Ill, N 423 33 10 3 5 More Table 3. Top 10 Districts (per ten million people)
The District of Utah — with 1101 convictions as compared with 210.4 convictions per ten million population in the United States — was the most active during October 2015.
The Western District of North Carolina (Asheville) ranked 2nd.
Southern District of Illinois (East St. Louis) is now ranking 3rd.
Recent entrants to the top 10 list were Eastern District of Missouri (St. Louis), now ranked 5th , and Southern District of Mississippi (Jackson) at 6th In the same order, these districts ranked 13th and 17th one year ago and 15th and 14th five years ago.
The federal judicial district which showed the greatest growth in the rate of white collar crime convictions compared to one year ago — 60 percent — was Southern District of Illinois (East St. Louis). Compared to five years ago, the district with the largest growth — 175 percent — was Maine .
In the last year, the judicial District Court recording the largest drop in the rate of white collar crime convictions — 45.9 percent — was Eastern District of Missouri (St. Louis). But over the past five years, Southern District of Florida (Miami) showed the largest drop — 57 percent.
Top Ranked District Judges
At any one time, there are about 680 federal District Court judges working in the United States. The judges recorded with the largest number of new white collar crime crime cases resulting in convictions of this type during October 2015 are shown in Table 4.
Judge Count Rank Stewart, Brian Theadore Utah 9 1 More Myerscough, Sue Ellen Ill, C 7 2 More Conrad, Robert James, Jr. N Car, W 7 2 More Ishii, Anthony W. Cal, E 6 4 More England, Morrison C., Jr. Cal, E 6 4 More Schlesinger, Harvey Erwin Fla, M 6 4 More Altonaga, Cecilia M. Fla, S 6 4 More Black, Timothy Seymour Ohio, S 6 4 More Autrey, Henry Edward Mo, E 5 9 More Boyko, Christopher A. Ohio, N 5 9 More Padova, John R. Penn, E 5 9 More Reeves, Pamela Lynn Tenn, E 5 9 More Waddoups, Clark Utah 5 9 More Table 4. Top Ten Judges
A total of 6 out of the "top ten" judges were in districts which were in the top ten with the largest number of white collar crime convictions per capita, while the remaining 7 judges were from other districts. (Because of ties, there were a total of 13 judges in the "top ten" rankings.)
Judge Brian Theadore Stewart in the District of Utah ranked 1st with 9 convicted in white collar crime convictions.
Judges Sue Ellen Myerscough in the Central District of Illinois (Springfield) and Robert James Conrad, Jr. in the Western District of North Carolina (Asheville) ranked 2nd with 7 convicted in white collar crime convictions.
Report Generated: December 17, 2015