White Collar Crime Prosecutions for January 2014
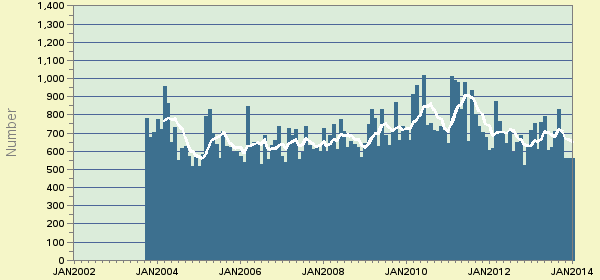
The latest available data from the Justice Department show that during January 2014 the government reported 561 new white collar crime prosecutions. According to the case-by-case information analyzed by the Transactional Records Access Clearinghouse (TRAC), this number is up 0.5% over the previous month.
White Collar Crime
This report summarizes the government's recent efforts when it comes to combating white collar crime—the number of such cases, the investigative agencies involved, the laws cited, the busiest federal districts and the busiest federal judges.
See more...The comparisons of the number of defendants charged with white collar crime-related offenses are based on case-by-case information obtained by TRAC under the Freedom of Information Act from the Executive Office for United States Attorneys. (See Table 1)
When monthly 2014 prosecutions of this type are compared with those of the same period in the previous year, the number of filings was up (3.3 percent). Prosecutions over the past year are still much higher than they were five years ago. Overall, the data show that prosecutions of this type are up 5 percent from levels reported in 2009.
The leveling out from the levels five years ago in white collar crime prosecutions for these matters is shown more clearly in Figure 1. The vertical bars in Figure 1 represent the number of white collar crime prosecutions of this type recorded on a month-to-month basis. Where a prosecution was initially filed in U.S. Magistrate Court and then transferred to the U.S. District Court, the magistrate filing date was used since this provides an earlier indicator of actual trends. The superimposed line on the bars plots the six-month moving average so that natural fluctuations are smoothed out. The one and five-year rates of change in Table 1 and in the sections that follow are all based upon this six-month moving average. To view trends year-by-year rather than month-by-month, see TRAC's annual report series for a broader picture.
Within the broad category of white collar crime, cases were classified by prosecutors into more specific types.
Case types within white collar crime are
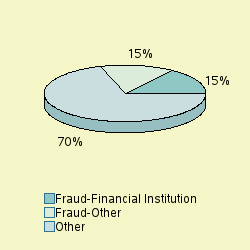
• Federal Procurement Fraud • Federal Program Fraud • Tax Fraud • Arson for Profit • Other Insurance Fraud • Financial Institution Fraud • Bankruptcy Fraud • Advance Fee Schemes • Other Fraud Against Businesses • Consumer Fraud • Securities Fraud • Commodities Fraud • Other Investment Fraud • Antitrust Violations - Other • Computer Fraud • Health Care Fraud • Fraud Against Insurance Providers • Intellectual Property Violations • Insider Fraud Against Insurance Providers • MEWA (Multiple Employer Welfare Arrangements) Fraud/MET • Antitrust Violations - Airlines • Antitrust Violations - Banking • Antitrust Violations - Defense Procurement • Antitrust Violations - Extraterritorial Application Of • Antitrust Violations - Finance Markets, Other than Banking • Telemarketing Fraud • Corporate Fraud • Identity Theft • Aggravated Identity Theft • Other White Collar Crime/Fraud The largest number of prosecutions of these matters in January 2014 was for "Fraud-Financial Institution", accounting for 15 percent of prosecutions. Prosecutions were also filed for "Fraud-Other" (15%), "Fraud-Tax" (14.1%), " Fraud-Identity Theft-Aggravated" (13.2%), "Fraud-Federal Program" (9.6%), "Fraud-Identity Theft-Other" (7.8%), "Fraud-Health Care" (6.2%), "Fraud-Other Business" (3.6%), "Fraud-Computer" (2.7%), "Fraud-Telemarketing" (2.1%). See Figure 2.
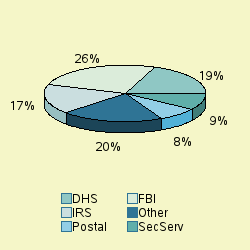
The lead investigative agency for white collar crime prosecutions in January 2014 was FBI accounting for 26 percent of prosecutions referred. Other agencies with substantial numbers of white collar crime referrals were: DHS (19% ), IRS (17%), SecServ (9%), Postal (8%). See Figure 3.
White Collar Crime Prosecutions in U.S. Magistrate Courts
Top Ranked Lead Charges
In January 2014, 99 defendants in white collar crime cases for these matters were filed in U.S. Magistrate Courts. These courts handle less serious misdemeanor cases, including what are called "petty offenses." In addition, complaints are sometimes filed in the magistrate courts before an indictment or information is entered. In these cases, the matter starts in the magistrate courts and later moves to the district court where subsequent proceedings take place.
In the magistrate courts in January the most frequently cited lead charge was Title 18 U.S.C Section 1028 involving the "Fraud and related activity - id documents". This was the lead charge for 22.2 percent of all magistrate filings in January.
Other frequently prosecuted lead charges include: "18 USC 371 - Conspiracy to commit offense or to defraud US" (13.1%), "18 USC 1028A - Aggravated Identity Theft" (13.1%), "18 USC 1343 - Fraud by wire, radio, or television" (8.1%), " 18 USC 641 - Public money, property or records" (7.1%), "08 USC 1326 - Reentry of deported alien" (5.1%), "18 USC 1029 - Fraud and related activity - access devices" (5.1%), "18 USC 1344 - Bank Fraud" (5.1%).
White Collar Crime Prosecutions in U.S. District Courts
In January 2014, 462 defendants in new cases for these matters were charged in the U.S. District Courts. In addition during January there were an additional 30 defendants whose cases moved from the magistrate courts to the U.S. district courts after an indictment or information was filed. The sections which follow cover both sets of cases and therefore cover all matters filed in district court during January.
Top Ranked Lead Charges
Table 2 shows the top lead charges recorded in the prosecutions of white collar crime matters filed in U.S. District Court during January 2014.
Lead Charge Count Rank 1yr ago 5yrs ago 18 USC 1349 - Mail Fraud - Attempt and Conspiracy 71 1 3 8 More 18 USC 1344 - Bank Fraud 48 2 2 1 More 18 USC 1343 - Fraud by wire, radio, or television 47 3 1 5 More 18 USC 641 - Public money, property or records 34 4 6 7 More 18 USC 371 - Conspiracy to commit offense or to defraud US 27 5 5 4 More 26 USC 7206 - Fraud and False statements 24 6 10 12 More 18 USC 286 - Conspiracy to defraud the Government claims 23 7 14 24 More 18 USC 1347 - Health Care Fraud 23 7 9 9 More 18 USC 1341 - Mail Fraud - Frauds and swindles 21 9 4 2 More 18 USC 1029 - Fraud and related activity - access devices 16 10 7 6 More Table 2: Top charges filed
"Mail Fraud - Attempt and Conspiracy" (Title 18 U.S.C Section 1349) was the most frequent recorded lead charge. "Mail Fraud - Attempt and Conspiracy" (Title 18 U.S.C Section 1349) was ranked 3 a year ago, while it was ranked 8 five years ago.
Ranked 2nd in frequency was the lead charge "Bank Fraud" under Title 18 U.S.C Section 1344. "Bank Fraud" under Title 18 U.S.C Section 1344 was ranked 2 a year ago, while it was ranked 1 five years ago.
Ranked 3rd was "Fraud by wire, radio, or television" under Title 18 U.S.C Section 1343. "Fraud by wire, radio, or television" under Title 18 U.S.C Section 1343 was ranked 1 a year ago, while it was ranked 5 five years ago.
Among these top ten lead charges, the one showing the greatest increase in prosecutions—up 31 percent—compared to one year ago was Title 18 U.S.C Section 1349 that involves " Mail Fraud - Attempt and Conspiracy ". Compared to five years ago, the largest increase—215 percent—was registered for prosecutions under " Conspiracy to defraud the Government claims " (Title 18 U.S.C Section 286 ).
Again among the top ten lead charges, the one showing the sharpest decline in prosecutions compared to one year ago—down 20.4 percent—was Mail Fraud - Frauds and swindles (Title 18 U.S.C Section 1341 ). Compared to five years ago, the most significant decline in prosecutions— 42.2 percent—was for filings where the lead charge was " Bank Fraud " (Title 18 U.S.C Section 1344 ).
Top Ranked Judicial Districts
In January 2014 the Justice Department said the government brought 188.1 white collar crime prosecutions for every ten million people in the United States.
Understandably, there is great variation in the per capita number of white collar crime prosecutions that are filed in each of the nation's ninety-four federal judicial districts.
The districts registering the largest number of prosecutions per capita for these matters last month are shown in Table 3. Districts must have at least 5 white collar crime prosecutions to receive a ranking.
Judicial District Percapita Count Rank 1yr ago 5yrs ago Wyoming 1,041 5 1 82 86 More Ill, S 936 10 2 61 63 More Miss, S 770 12 3 29 4 More Mich, W 524 15 4 44 58 More Hawaii 517 6 5 61 73 More Fla, S 364 21 6 1 1 More Ga, M 358 6 7 41 69 More Tenn, E 329 7 8 58 57 More N. Y., S 326 14 9 2 3 More Ohio, S 291 14 10 21 49 More Table 3: Top 10 districts (per ten million people)
The District of Wyoming—with 1041 prosecutions as compared with 188.1 prosecutions per ten million population in the United States—was the most active during January 2014.
The Southern District of Illinois (East St. Louis) ranked 2nd.
Southern District of Mississippi (Jackson) is now ranking 3rd.
Recent entrants to the top 10 list were Southern District of Ohio (Cincinnati), now ranked 10th , and Southern District of Mississippi (Jackson) at 3rd In the same order, these districts ranked 21st and 29th one year ago and 49th and 4th five years ago.
The federal judicial district which showed the greatest growth in the rate of white collar crime prosecutions compared to one year ago— 127.8 percent—was Southern District of Illinois (East St. Louis). This was the same district that had the largest increase— 127.8 percent—when compared with five years ago.
In the last year, the judicial District Court recording the largest drop in the rate of white collar crime prosecutions— 45.5 percent—was Middle District of Georgia (Macon). But over the past five years, Southern District of Mississippi (Jackson) showed the largest drop— 50 percent.
Top Ranked District Judges
At any one time, there are about 680 federal District Court judges working in the United States. The judges recorded with the largest number of new white collar crime crime cases of this type during January 2014 are shown in Table 4.
Judge Count Rank 1yr ago 5yrs ago Gelpi, Gustavo Antonio, Jr. Puer Rico 52 1 66 312 More Jonker, Robert James Mich, W 14 2 43 421 More Moore, Kevin Michael Fla, S 9 3 91 188 More Reeves, Carlton Wayne Miss, S 7 4 - - More Battaglia, Anthony M. Cal, S 6 5 344 - More Berg, Terrence George Mich, E 6 5 - - More Weber, Herman Jacob Ohio, S 6 5 145 312 More Adams, Henry Lee, Jr. Fla, M 5 8 453 116 More Lawson, Hugh Ga, M 5 8 274 421 More Herndon, David R. Ill, S 5 8 344 312 More Reagan, Michael Joseph Ill, S 5 8 344 188 More Bartle, Harvey, III Penn, E 5 8 66 312 More Table 4: Top 10 judges
A total of 7 out of the "top ten" judges were in districts which were in the top ten with the largest number of white collar crime filings per capita, while the remaining 5 judges were from other districts. (Because of ties, there were a total of 12 judges in the "top ten" rankings.)
Judge Gustavo Antonio Gelpi, Jr. in the District of Puerto Rico ranked 1st with 52 defendants in white collar crime cases.
Judge Robert James Jonker in the Western District of Michigan (Grand Rapids) ranked 2nd with 14 defendants in white collar crime cases.
Judge Kevin Michael Moore in the Southern District of Florida (Miami) ranked 3rd with 9 defendants in white collar crime cases.
Report Generated: March 17, 2014