Civil Filings for September 2018
Table 1. Civil Filings
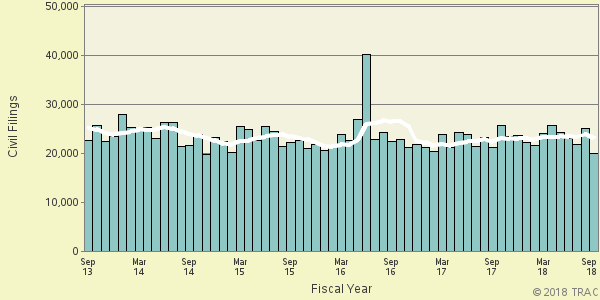
Number Latest Month 20,118 Percent Change from previous month -20.4% Percent Change from 1 year ago 3.8% Percent Change from 5 years ago -7.4% The latest available data from the federal courts show that during September 2018 the government reported 20,118 new civil filings. According to the case-by-case information analyzed by the Transactional Records Access Clearinghouse (TRAC), this number is down 20.4% over the previous month when the number of civil filings of this type totaled 25,278.
The comparisons of the number of civil filings are based on case-by-case court records which were compiled and analyzed by TRAC (see Table 1).
When monthly 2018 civil filings of this type are compared with those of the same period in the previous year, their number was up (3.8%). Civil filings for September 2018 are lower than they were for the same period five years ago. Overall, the data show that civil filings of this type are down 7.4% from levels reported in September 2013.
The long term trend in civil filings for these matters going back five years is shown more clearly in Figure 1. The vertical bars in Figure 1 represent the number of civil filings of this type recorded each month. The superimposed line on the bars plots the six-month moving average so that natural fluctuations are smoothed out. One-year and five-year change comparisons are based upon the moving averages.
Types of filings
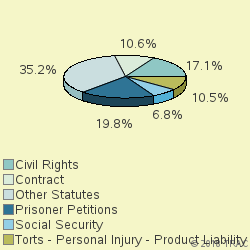
Cases were classified by the federal courts into general types. The single largest number of civil filings of these matters during September 2018 was for "Prisoner Petitions", accounting for 19.8% of civil filings.
As shown in Figure 2, additional categories with substantial numbers of civil filings were "Civil Rights " (17.1%) , "Contract" (10.6%), "Torts - Personal Injury - Product Liability" (10.5%), "Social Security" (6.8%).
Jurisdiction
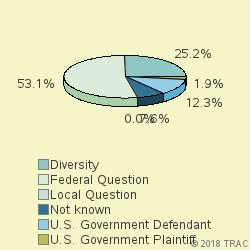
Within limits set by Congress and the Constitution, the federal district courts have jurisdiction to hear cases falling under any one of several categories. The single largest number of civil filings of these matters during September 2018 was under the classification "Federal Question", accounting for 53.1% of civil filings.
As shown in Figure 2, additional categories with substantial numbers of civil filings were "Diversity" (25.2%) , "U.S. Government Defendant" (12.3%), "U.S. Government Plaintiff" (1.9%), "Local Question" (0.0%).
Rankings: Specific Nature of Suits
Court filings are also classified based upon the specific nature of the suit. Table 2 shows the top nature of suit categories recorded in the matters filed during September 2018
Table 2. Top District filed
Nature of Suit Count Rank 1 yr ago 5 yrs ago Health Care / Pharmaceutical Personal Injury Product Liability 1,497 1 1 9 More Civil Rights 1,486 2 2 3 More General Prisoner Petitions 1,239 3 3 2 More Other Civil Rights 1,190 4 4 4 More Employment 1,093 5 5 6 More Insurance 975 6 8 10 More Other Contract 841 7 7 8 More Amer w/Disabilities - Other 799 8 16 22 More Prison Condition 770 9 10 5 More Consumer Credit 767 10 6 12 More
"Health Care / Pharmaceutical Personal Injury Product Liability" was the most frequent recorded nature of suit category. "Health Care / Pharmaceutical Personal Injury Product Liability" was ranked 1st a year ago, while it was the 9th most frequently invoked five years ago.
Ranked 2nd in frequency was the nature of suit category "Civil Rights". "Civil Rights" was ranked 2nd a year ago, while it was the 3rd most frequently invoked five years ago.
Ranked 3rd was "General Prisoner Petitions". "General Prisoner Petitions" was ranked 3rd a year ago, while it was the 2nd most frequently invoked five years ago.
Among these top nature of suit categories, the one showing the greatest increase in civil filings — up 42.9 percent — compared to one year ago was "Amer w/Disabilities - Other". This was the same category that had the largest increase — 182.3 percent — when compared with five years ago.
Again among the top ten nature of suit categories, the one showing the sharpest decline in civil filings compared to one year ago — down 37.7 percent — was "Health Care / Pharmaceutical Personal Injury Product Liability". This was the same statute that had the largest decrease — 38.9 percent — when compared with five years ago.
Top Ranked Judicial Districts
Relative to population, the volume of civil matters of this type filed in federal district courts during September 2018 was 62.3 per every million persons in the United States. One year ago the relative number of filings was 65.9. Understandably, there is great variation in the per capita number of civil filings in each of the nation's ninety-four federal judicial districts.
Table 3. Top Ten Districts (per one million people)
Judicial District Percapita Count Rank 1yr ago 5yrs ago La, E 409.5 688 1 1 6 More D. C. 311.2 212 2 2 2 More N. Y., S 185.8 975 3 4 5 More Delaware 168.1 160 4 6 7 More Fla, S 125.9 922 5 14 9 More N. J. 119.5 1,069 6 7 25 More Ark, E 98.8 162 7 10 22 More Ind, S 95.9 388 8 5 35 More Penn, E 93.0 545 9 15 3 More Nevada 85.4 251 10 9 12 More
The Eastern District of Louisiana — with 409.5 civil filings as compared with 62.3 civil filings per one million people in the United States — was the most active during September 2018. The Eastern District of Louisiana was ranked 1st a year ago, while it was ranked 6th five years ago.
The District of Washington, D.C. ranked 2nd. The District of Washington, D.C. was ranked 2nd a year ago as well as five years ago.
The Southern District of New York now ranks 3rd. The Southern District of New York was ranked 4th a year ago, while it was ranked 5th five years ago.
Recent entries to the top 10 list were Southern District of Florida (Miami) and Eastern District of Pennsylvania (Philadelphia), now ranked 5th and 9th. These districts ranked 14th and 15th one year ago and 9th and 3rd five years ago.
The federal judicial district which showed the greatest growth in the rate of civil filings compared to one year ago — 53.2 percent — was Southern District of Florida. Compared to five years ago, the district with the largest growth — 194.3 percent — was Eastern District of Louisiana .
In the last year, the judicial District Court recording the largest drop in the rate of civil filings — 48.1 percent — was Eastern District of Louisiana. But over the past five years, Eastern District of Pennsylvania showed the largest drop — 54.6 percent.
Report Generated: October 22, 2018