Prosecutions for October 2012
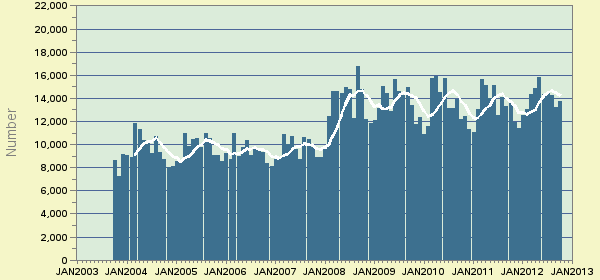
The latest available data from the Justice Department show that during October 2012 the government reported 13764 new prosecutions. According to the case-by-case information analyzed by the Transactional Records Access Clearinghouse (TRAC), this number is up 4.5% over the previous month.
The comparisons of the number of defendants charged are based on case-by-case information obtained by TRAC under the Freedom of Information Act from the Executive Office for United States Attorneys. (See Table 1)
When monthly 2012 prosecutions of this type are compared with those of the same period in the previous year, the number of filings was up (4 percent). Prosecutions over the past year are still much higher than they were five years ago. Overall, the data show that prosecutions of this type are up 43.4 percent from levels reported in 2007.
The increase from the levels five years ago in prosecutions for these matters is shown more clearly in Figure 1. The vertical bars in Figure 1 represent the number of prosecutions of this type recorded on a month-to-month basis. Where a prosecution was initially filed in U.S. Magistrate Court and then transferred to the U.S. District Court, the magistrate filing date was used since this provides an earlier indicator of actual trends. The superimposed line on the bars plots the six-month moving average so that natural fluctuations are smoothed out. The one and five-year rates of change in Table 1 and in the sections that follow are all based upon this six-month moving average. To view trends year-by-year rather than month-by-month, see TRAC's annual report series for a broader picture.
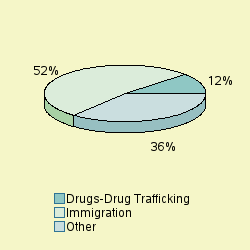
Cases were classified by prosecutors into more specific types.
The largest number of prosecutions of these matters in October 2012 was for "Immigration", accounting for 52.1 percent of prosecutions. Prosecutions were also filed for "Drugs-Drug Trafficking" (11.8%), " Withheld by Govt from TRAC (FOIA challen" (8%), "Drugs-Organized Crime Task Force" (4.7%), "Weapons-Operation Triggerlock Major" (4.5%), "Assimilated Crimes" (3.7%), "Other Criminal Prosecutions" (2.9%). See Figure 2.
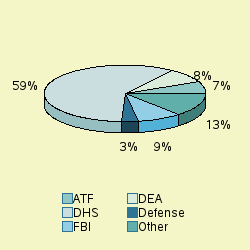
The lead investigative agency for prosecutions in October 2012 was DHS accounting for 59 percent of prosecutions referred. Other agencies with substantial numbers of referrals were: FBI (9% ), DEA (8%), ATF (7%), Defense (3%). See Figure 3.
Prosecutions in U.S. Magistrate Courts
Top Ranked Lead Charges
In October 2012, 8353 defendants in cases for these matters were filed in U.S. Magistrate Courts. These courts handle less serious misdemeanor cases, including what are called "petty offenses." In addition, complaints are sometimes filed in the magistrate courts before an indictment or information is entered. In these cases, the matter starts in the magistrate courts and later moves to the district court where subsequent proceedings take place.
In the magistrate courts in October the most frequently cited lead charge was Title 8 U.S.C Section 1325 involving the "Entry of alien at improper time or place; etc.". This was the lead charge for 42.1 percent of all magistrate filings in October.
Other frequently prosecuted lead charges include: "08 USC 1326 - Reentry of deported alien" (26.7%).
Prosecutions in U.S. District Courts
In October 2012, 5411 defendants in new cases for these matters were charged in the U.S. District Courts. In addition during October there were an additional 2004 defendants whose cases moved from the magistrate courts to the U.S. district courts after an indictment or information was filed. The sections which follow cover both sets of cases and therefore cover all matters filed in district court during October.
Top Ranked Lead Charges
Table 2 shows the top lead charges recorded in the prosecutions of matters filed in U.S. District Court during October 2012.
Lead Charge Count Rank 1yr ago 5yrs ago 08 USC 1326 - Reentry of deported alien 1,834 1 1 1 More 21 USC 841 - Drug Abuse Prevention & Control-Prohibited acts A 1,056 2 2 2 More 21 USC 846 - Attempt and conspiracy 670 3 3 3 More 18 USC 922 - Firearms; Unlawful acts 515 4 4 4 More 08 USC 1324 - Bringing in and harboring certain aliens 241 5 5 5 More 21 USC 952 - Importation of controlled substances 145 6 6 8 More 18 USC 371 - Conspiracy to commit offense or to defraud US 102 7 7 8 More 18 USC 2252 - Material involving sexual exploitation of minors 92 8 8 10 More 18 USC 1546 - Fraud and misuse of visas, permits, and other documents 88 9 9 14 More 18 USC 1956 - Laundering of monetary instruments 73 10 25 22 More Table 2: Top charges filed
"Reentry of deported alien" (Title 8 U.S.C Section 1326) was the most frequent recorded lead charge. "Reentry of deported alien" (Title 8 U.S.C Section 1326) was ranked 1 a year ago, while it was ranked 1 five years ago.
Ranked 2nd in frequency was the lead charge "Drug Abuse Prevention & Control-Prohibited acts A" under Title 21 U.S.C Section 841. "Drug Abuse Prevention & Control-Prohibited acts A" under Title 21 U.S.C Section 841 was ranked 2 a year ago, while it was ranked 2 five years ago.
Ranked 3rd was "Attempt and conspiracy" under Title 21 U.S.C Section 846. "Attempt and conspiracy" under Title 21 U.S.C Section 846 was ranked 3 a year ago, while it was ranked 3 five years ago.
Among these top ten lead charges, the one showing the greatest increase in prosecutions—up 21 percent—compared to one year ago was Title 18 U.S.C Section 1956 that involves " Laundering of monetary instruments ". Compared to five years ago, the largest increase—49.1 percent—was registered for prosecutions under " Reentry of deported alien " (Title 8 U.S.C Section 1326 ).
Again among the top ten lead charges, the one showing the sharpest decline in prosecutions compared to one year ago—down 21.6 percent—was Conspiracy to commit offense or to defraud US (Title 18 U.S.C Section 371 ). Compared to five years ago, the most significant decline in prosecutions— 27.5 percent—was for filings where the lead charge was " Bringing in and harboring certain aliens " (Title 8 U.S.C Section 1324 ).
Top Ranked Judicial Districts
In October 2012 the Justice Department said the government brought 2898.3 prosecutions for every ten million people in the United States.
Understandably, there is great variation in the per capita number of prosecutions that are filed in each of the nation's ninety-four federal judicial districts.
The districts registering the largest number of prosecutions per capita for these matters last month are shown in Table 3. Districts must have at least 5 prosecutions to receive a ranking.
Judicial District Percapita Count Rank 1yr ago 5yrs ago N Mexico 19,167 321 1 5 5 More Cal, S 17,400 467 2 3 4 More Texas, W 13,329 681 3 1 2 More Texas, S 10,487 735 4 4 1 More N Dakota 9,276 50 5 66 71 More S Dakota 7,977 54 6 45 56 More Arizona 7,787 428 7 2 3 More D. C. 7,204 36 8 57 83 More Ala, S 5,961 41 9 47 40 More La, M 5,795 38 10 85 87 More Table 3: Top 10 districts (per ten million people)
The District of New Mexico—with 19167 prosecutions as compared with 2898.3 prosecutions per ten million population in the United States—was the most active during October 2012. The District of New Mexico was ranked 5 a year ago, while it was ranked 5 for most frequent use five years ago.
The Southern District of California (San Diego) ranked 2nd. The Southern District of California (San Diego) was ranked 3 a year ago, while it was ranked 4 for most frequent use five years ago.
Western District of Texas (San Antonio) is now ranking 3rd. The Western District of Texas (San Antonio) was ranked 1 a year ago, while it was ranked 2 for most frequent use five years ago.
Recent entrants to the top 10 list were South Dakota , now ranked 6th , and Southern District of Alabama (Mobile) at 9th In the same order, these districts ranked 45th and 47th one year ago and 56th and 40th five years ago.
The federal judicial district which showed the greatest growth in the rate of prosecutions compared to one year ago— 42.7 percent—was South Dakota . Compared to five years ago, the district with the largest growth— 72.3 percent—was Middle District of Louisiana (Baton Rouge).
In the last year, the judicial District Court recording the largest drop in the rate of prosecutions— 36.3 percent—was Washington, D.C. (Washington). But over the past five years, Southern District of Alabama (Mobile) showed the largest drop— 36.1 percent.
Top Ranked District Judges
At any one time, there are about 680 federal District Court judges working in the United States. The judges recorded with the largest number of new crime cases of this type during October 2012 are shown in Table 4.
Judge Count Rank 1yr ago 5yrs ago Brack, Robert C. N Mexico 200 1 63 5 More Moses, Alia Texas, W 139 2 1 - More Junell, Robert A. Texas, W 100 3 2 13 More Alvarez, Micaela Texas, S 88 4 10 4 More Hinojosa, Ricardo H. Texas, S 87 5 7 10 More Dominguez, Daniel R. Puer Rico 80 6 37 112 More Fuste, Jose Antonio Puer Rico 73 7 82 67 More Crane, Randy Texas, S 63 8 6 3 More Cerezo, Carmen Consuelo Puer Rico 60 9 282 342 More Cardone, Kathleen Texas, W 59 10 7 9 More Martinez, Philip Ray Texas, W 59 10 13 8 More Table 4: Top 10 judges
A total of 8 out of the "top ten" judges were in districts which were in the top ten with the largest number of filings per capita, while the remaining 3 judges were from other districts. (Because of ties, there were a total of 11 judges in the "top ten" rankings.)
Judge Robert C. Brack in the District of New Mexico ranked 1st with 200 defendants in cases.
Judge Alia Moses in the Western District of Texas (San Antonio) ranked 2nd with 139 defendants in cases. Judge Mosesalso appeared in the top ten rankings one year ago(ranked 1).
Judge Robert A. Junell in the Western District of Texas (San Antonio) ranked 3rd with 100 defendants in cases. Judge Junellalso appeared in the top ten rankings one year ago(ranked 2).
Report Generated: February 6, 2013