Prosecutions for March 2018
The latest available data from the Justice Department show that during March 2018 the government reported 13083 new prosecutions. According to the case-by-case information analyzed by the Transactional Records Access Clearinghouse (TRAC), this number is up 20.9 percent over the previous month.
The comparisons of the number of defendants charged are based on case-by-case information obtained by TRAC under the Freedom of Information Act from the Executive Office for United States Attorneys (see Table 1).
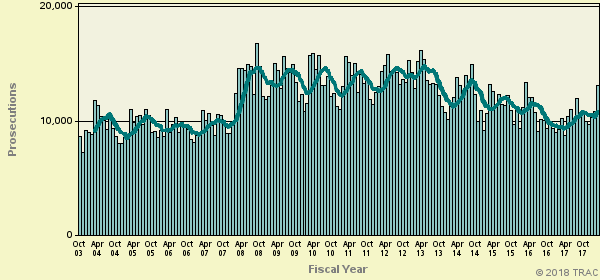
When monthly 2018 prosecutions of this type are compared with those of the same period in the previous year, the number of filings was up (13.3%). Prosecutions over the past year are still much lower than they were five years ago. Overall, the data show that prosecutions of this type are down 23.6 percent from levels reported in 2013.
The dip in these cases is partly related to increases in the matters filed in U.S. Magistrate Courts. If magistrate cases are excluded and only Federal District Court cases are counted, the overall decrease in prosecutions is 12.3 percent instead of 23.6 percent. The evidence suggests that part of the difference may be the result of improvements in the recording of the magistrate cases by the Justice Department.
The decrease from the levels five years ago in prosecutions for these matters is shown more clearly in Figure 1. The vertical bars in Figure 1 represent the number of prosecutions of this type recorded on a month-to-month basis. Where a prosecution was initially filed in U.S. Magistrate Court and then transferred to the U.S. District Court, the magistrate filing date was used since this provides an earlier indicator of actual trends. The superimposed line on the bars plots the six-month moving average so that natural fluctuations are smoothed out. The one and five-year rates of change in Table 1 and in the sections that follow are all based upon this six-month moving average. To view trends year-by-year rather than month-by-month, see TRAC's annual report series for a broader picture.
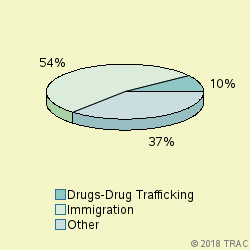
Cases were classified by prosecutors into more specific types.
The largest number of prosecutions of these matters in March 2018 was for "Immigration", accounting for 53.7 percent of prosecutions. Prosecutions were also filed for "Drugs-Drug Trafficking" (9.8%), "Withheld by Govt from TRAC (FOIA challen" (8.4%), "Weapons-Operation Triggerlock Major" (7.3%), "Drugs-Organized Crime Task Force" (2.7%), "Assimilated Crimes" (2.6%), "Other Criminal Prosecutions" (2.2%). See Figure 2.
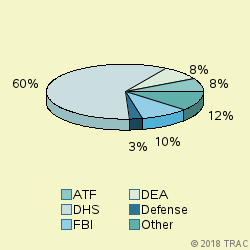
The lead investigative agency for prosecutions in March 2018 was DHS accounting for 60 percent of prosecutions referred. Other agencies with substantial numbers of referrals were: FBI (10% ), DEA (8%), ATF (8%), Defense (3%). See Figure 3.
Prosecutions in U.S. Magistrate Courts
Top Ranked Lead Charges
In March 2018, 7592 defendants in cases for these matters were filed in U.S. Magistrate Courts. These courts handle less serious misdemeanor cases, including what are called "petty offenses." In addition, complaints are sometimes filed in the magistrate courts before an indictment or information is entered. In these cases, the matter starts in the magistrate courts and later moves to the district court where subsequent proceedings take place.
In the magistrate courts in March the most frequently cited lead charge was Title 8 U.S.C Section 1325 involving "Entry of alien at improper time or place; etc.". This was the lead charge for 50.4 percent of all magistrate filings in March.
Other frequently prosecuted lead charges include: "08 USC 1326 - Reentry of deported alien" (23.3%).
Prosecutions in U.S. District Courts
In March 2018, 5491 defendants in new cases for these matters were charged in the U.S. District Courts. In addition during March there were an additional 2312 defendants whose cases moved from the magistrate courts to the U.S. district courts after an indictment or information was filed. The sections which follow cover both sets of cases and therefore cover all matters filed in district court during March.
Top Ranked Lead Charges
Table 2 shows the top lead charges recorded in the prosecutions of matters filed in U.S. District Court during March 2018.
Lead Charge Count Rank 1yr ago 5yrs ago 08 USC 1326 - Reentry of deported alien 1,802 1 1 1 More 21 USC 841 - Drug Abuse Prevention & Control-Prohibited acts A 982 2 2 2 More 18 USC 922 - Firearms; Unlawful acts 798 3 3 4 More 21 USC 846 - Attempt and conspiracy 508 4 4 3 More 08 USC 1324 - Bringing in and harboring certain aliens 352 5 5 5 More 08 USC 1325 - Entry of alien at improper time or place; etc. 221 6 26 27 More 21 USC 952 - Importation of controlled substances 149 7 6 6 More 18 USC 1343 - Fraud by wire, radio, or television 107 8 9 12 More 18 USC 1951 - Hobbs Act 90 10 12 13 More Table 2. Top Charges Filed
"Reentry of deported alien" (Title 8 U.S.C Section 1326) was the most frequent recorded lead charge. "Reentry of deported alien" (Title 8 U.S.C Section 1326) was ranked 1 a year ago, while it was ranked 1 five years ago.
Ranked 2nd in frequency was the lead charge "Drug Abuse Prevention & Control-Prohibited acts A" under Title 21 U.S.C Section 841. "Drug Abuse Prevention & Control-Prohibited acts A" under Title 21 U.S.C Section 841 was ranked 2 a year ago, while it was ranked 2 five years ago.
Ranked 3rd was "Firearms; Unlawful acts" under Title 18 U.S.C Section 922. "Firearms; Unlawful acts" under Title 18 U.S.C Section 922 was ranked 3 a year ago, while it was ranked 4 five years ago.
Among these top ten lead charges, the one showing the greatest increase in prosecutions — up 476 percent — compared to one year ago was Title 8 U.S.C Section 1325 that involves " Entry of alien at improper time or place; etc. ". This was the same statute that had the largest increase — 472.3 % — when compared with five years ago.
Again among the top ten lead charges, the one showing the sharpest decline in prosecutions compared to one year ago — down 12.2 percent — was " Attempt and conspiracy " (Title 21 U.S.C Section 846 ). This was the same statute that had the largest decrease — 30.4 % — when compared with five years ago.
Top Ranked Judicial Districts
In March 2018 the Justice Department said the government brought 2897.8 prosecutions for every ten million people in the United States.
Understandably, there is great variation in the per capita number of prosecutions that are filed in each of the nation's ninety-four federal judicial districts.
The districts registering the largest number of prosecutions per capita for these matters last month are shown in Table 3. Districts must have at least 5 prosecutions to receive a ranking.
Judicial District Percapita Count Rank 1yr ago 5yrs ago Cal, S 24,318 709 1 4 3 More N Mexico 20,067 348 2 5 5 More Texas, W 14,767 873 3 1 2 More D. C. 9,337 53 4 75 47 More Texas, S 8,678 695 5 2 1 More Wyoming 7,788 38 6 69 71 More La, M 7,471 52 7 84 82 More Tenn, W 6,729 88 8 35 38 More W Virg, N 6,715 52 9 59 79 More Arizona 6,215 359 10 3 4 More Table 3. Top 10 Districts (per ten million people)
The Southern District of California (San Diego) — with 24318 prosecutions as compared with 2897.8 prosecutions per ten million population in the United States — was the most active during March 2018. The Southern District of California (San Diego) was ranked 4 a year ago, while it was ranked 3 for most frequent use five years ago.
The District of New Mexico ranked 2nd. The District of New Mexico was ranked 5 a year ago, while it was ranked 5 for most frequent use five years ago.
Western District of Texas (San Antonio) is now ranking 3rd. The Western District of Texas (San Antonio) was ranked 1 a year ago, while it was ranked 2 for most frequent use five years ago.
Recent entrants to the top 10 list were Western District of Tennessee (Memphis), now ranked 8th , and Northern District of West Virginia (Wheeling) at 9th In the same order, these districts ranked 35th and 59th one year ago and 38th and 79th five years ago.
The federal judicial district which showed the greatest growth in the rate of prosecutions compared to one year ago — 80 percent — was Southern District of California (San Diego). Compared to five years ago, the district with the largest growth — 37.8 percent — was Northern District of West Virginia (Wheeling).
In the last year, the judicial District Court recording the largest drop in the rate of prosecutions — 20.8 percent — was Wyoming . But over the past five years, Washington, D.C. (Washington) showed the largest drop — 35.7 percent.
Top Ranked District Judges
At any one time, there are about 680 federal District Court judges working in the United States. The judges recorded with the largest number of new crime cases of this type during March 2018 are shown in Table 4.
Judge Count Rank 1yr ago 5yrs ago Moses, Alia M. Texas, W 228 1 1 3 More Counts, Walter David, III Texas, W 160 2 - - More Gonzales, Kenneth John N Mexico 108 3 5 - More Brack, Robert C. N Mexico 105 4 2 1 More Cerezo, Carmen Consuelo Puer Rico 93 5 79 48 More Lewis, Peter C. Cal, S 78 6 594 720 More Alvarez, Micaela Texas, S 75 7 8 6 More Curiel, Gonzalo Paul Cal, S 73 8 57 19 More Ramos, Nelva Gonzales Texas, S 73 8 13 12 More Hinojosa, Ricardo H. Texas, S 70 10 3 4 More Table 4. Top Ten Judges
A total of 9 out of the "top ten" judges were in districts which were in the top ten with the largest number of filings per capita, while the remaining 1 judges were from other districts.
Judge Alia M. Moses in the Western District of Texas (San Antonio) ranked 1st with 228 defendants in cases. Judge Moses appeared in the top ten rankings one year (ranked 1) and five years ago (rank 3).
Judge Walter David Counts, III in the Western District of Texas (San Antonio) ranked 2nd with 160 defendants in cases.
Judge Kenneth John Gonzales in the District of New Mexico ranked 3rd with 108 defendants in cases. Judge Gonzales also appeared in the top ten rankings one year ago (ranked 5).
Report Generated: April 26, 2018