Prosecutions for December 2016
The latest available data from the Justice Department show that during December 2016 the government reported 9397 new prosecutions. According to the case-by-case information analyzed by the Transactional Records Access Clearinghouse (TRAC), this number is down 5.5 percent over the previous month.
The comparisons of the number of defendants charged are based on case-by-case information obtained by TRAC under the Freedom of Information Act from the Executive Office for United States Attorneys (see Table 1).
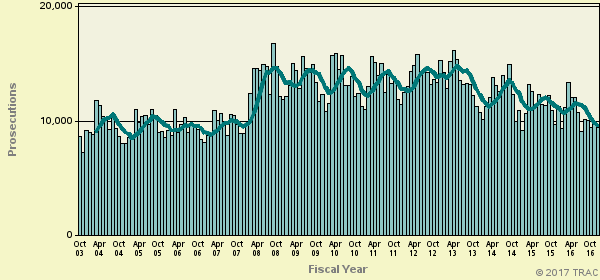
When monthly 2016 prosecutions of this type are compared with those of the same period in the previous year, the number of filings was down (-13.3%). Prosecutions over the past year are still much lower than they were five years ago. Overall, the data show that prosecutions of this type are down 24.4 percent from levels reported in 2011.
The decrease from the levels five years ago in prosecutions for these matters is shown more clearly in Figure 1. The vertical bars in Figure 1 represent the number of prosecutions of this type recorded on a month-to-month basis. Where a prosecution was initially filed in U.S. Magistrate Court and then transferred to the U.S. District Court, the magistrate filing date was used since this provides an earlier indicator of actual trends. The superimposed line on the bars plots the six-month moving average so that natural fluctuations are smoothed out. The one and five-year rates of change in Table 1 and in the sections that follow are all based upon this six-month moving average. To view trends year-by-year rather than month-by-month, see TRAC's annual report series for a broader picture.
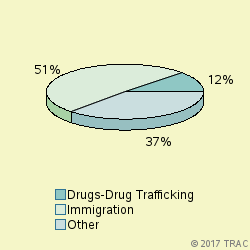
Cases were classified by prosecutors into more specific types.
The largest number of prosecutions of these matters in December 2016 was for "Immigration", accounting for 51.1 percent of prosecutions. Prosecutions were also filed for "Drugs-Drug Trafficking" (12%), "Withheld by Govt from TRAC (FOIA challen" (8.6%), "Weapons-Operation Triggerlock Major" (5.4%), "Other Criminal Prosecutions" (3.9%), "Assimilated Crimes" (3%), "Drugs-Organized Crime Task Force" (2.8%). See Figure 2.
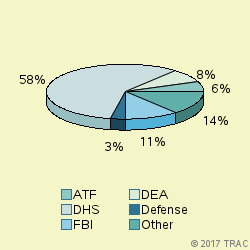
The lead investigative agency for prosecutions in December 2016 was DHS accounting for 58 percent of prosecutions referred. Other agencies with substantial numbers of referrals were: FBI (11% ), DEA (8%), ATF (6%), Defense (3%). See Figure 3.
Prosecutions in U.S. Magistrate Courts
Top Ranked Lead Charges
In December 2016, 5655 defendants in cases for these matters were filed in U.S. Magistrate Courts. These courts handle less serious misdemeanor cases, including what are called "petty offenses." In addition, complaints are sometimes filed in the magistrate courts before an indictment or information is entered. In these cases, the matter starts in the magistrate courts and later moves to the district court where subsequent proceedings take place.
In the magistrate courts in December the most frequently cited lead charge was Title 8 U.S.C Section 1325 involving "Entry of alien at improper time or place; etc.". This was the lead charge for 41.7 percent of all magistrate filings in December.
Other frequently prosecuted lead charges include: "08 USC 1326 - Reentry of deported alien" (25.6%).
Prosecutions in U.S. District Courts
In December 2016, 3742 defendants in new cases for these matters were charged in the U.S. District Courts. In addition during December there were an additional 1813 defendants whose cases moved from the magistrate courts to the U.S. district courts after an indictment or information was filed. The sections which follow cover both sets of cases and therefore cover all matters filed in district court during December.
Top Ranked Lead Charges
Table 2 shows the top lead charges recorded in the prosecutions of matters filed in U.S. District Court during December 2016.
Lead Charge Count Rank 1yr ago 5yrs ago 08 USC 1326 - Reentry of deported alien 1,349 1 1 1 More 21 USC 841 - Drug Abuse Prevention & Control-Prohibited acts A 744 2 2 2 More 18 USC 922 - Firearms; Unlawful acts 454 3 4 4 More 21 USC 846 - Attempt and conspiracy 375 4 3 3 More 08 USC 1324 - Bringing in and harboring certain aliens 285 5 5 5 More 21 USC 952 - Importation of controlled substances 117 6 6 6 More 18 USC 2252 - Material involving sexual exploitation of minors 76 7 7 8 More 18 USC 2113 - Bank robbery and incidental crimes 62 8 9 11 More 18 USC 641 - Public money, property or records 61 9 8 13 More 18 USC 1343 - Fraud by wire, radio, or television 52 10 10 10 More Table 2. Top Charges Filed
"Reentry of deported alien" (Title 8 U.S.C Section 1326) was the most frequent recorded lead charge. "Reentry of deported alien" (Title 8 U.S.C Section 1326) was ranked 1 a year ago, while it was ranked 1 five years ago.
Ranked 2nd in frequency was the lead charge "Drug Abuse Prevention & Control-Prohibited acts A" under Title 21 U.S.C Section 841. "Drug Abuse Prevention & Control-Prohibited acts A" under Title 21 U.S.C Section 841 was ranked 2 a year ago, while it was ranked 2 five years ago.
Ranked 3rd was "Firearms; Unlawful acts" under Title 18 U.S.C Section 922. "Firearms; Unlawful acts" under Title 18 U.S.C Section 922 was ranked 4 a year ago, while it was ranked 4 five years ago.
Among these top ten lead charges, the one showing the greatest increase in prosecutions — up 19.8 percent — compared to one year ago was Title 8 U.S.C Section 1324 that involves " Bringing in and harboring certain aliens ". This was the same statute that had the largest increase — 26.7 % — when compared with five years ago.
Again among the top ten lead charges, the one showing the sharpest decline in prosecutions compared to one year ago — down 25.8 percent — was " Public money, property or records " (Title 18 U.S.C Section 641 ). Compared to five years ago, the most significant decline in prosecutions — 49.2 percent — was for filings where the lead charge was " Importation of controlled substances " (Title 21 U.S.C Section 952 ).
Top Ranked Judicial Districts
In December 2016 the Justice Department said the government brought 2073.9 prosecutions for every ten million people in the United States.
Understandably, there is great variation in the per capita number of prosecutions that are filed in each of the nation's ninety-four federal judicial districts.
The districts registering the largest number of prosecutions per capita for these matters last month are shown in Table 3. Districts must have at least 5 prosecutions to receive a ranking.
Judicial District Percapita Count Rank 1yr ago 5yrs ago N Mexico 17,841 310 1 3 5 More Cal, S 11,035 320 2 5 2 More Texas, W 10,282 598 3 2 1 More Texas, S 7,153 565 4 1 4 More S Dakota 7,108 50 5 40 40 More Arizona 7,065 402 6 4 3 More D. C. 4,820 27 7 72 65 More Wash, E 4,447 58 8 63 62 More Ala, S 4,271 30 9 60 58 More W Virg, N 4,123 32 10 69 71 More Table 3. Top 10 Districts (per ten million people)
The District of New Mexico — with 17841 prosecutions as compared with 2073.9 prosecutions per ten million population in the United States — was the most active during December 2016. The District of New Mexico was ranked 3 a year ago, while it was ranked 5 for most frequent use five years ago.
The Southern District of California (San Diego) ranked 2nd. The Southern District of California (San Diego) was ranked 5 a year ago, while it was ranked 2 for most frequent use five years ago.
Western District of Texas (San Antonio) is now ranking 3rd. The Western District of Texas (San Antonio) was ranked 2 a year ago, while it was ranked 1 for most frequent use five years ago.
Recent entrants to the top 10 list were South Dakota , now ranked 5th , and Southern District of Alabama (Mobile) at 9th In the same order, these districts ranked 40th and 60th one year ago and 40th and 58th five years ago.
The federal judicial district which showed the greatest growth in the rate of prosecutions compared to one year ago — 30.1 percent — was Eastern District of Washington (Spokane). Compared to five years ago, the district with the largest growth — 33.7 percent — was New Mexico .
In the last year, the judicial District Court recording the largest drop in the rate of prosecutions — 22 percent — was New Mexico . But over the past five years, Southern District of California (San Diego) showed the largest drop — 54.2 percent.
Top Ranked District Judges
At any one time, there are about 680 federal District Court judges working in the United States. The judges recorded with the largest number of new crime cases of this type during December 2016 are shown in Table 4.
Judge Count Rank 1yr ago 5yrs ago Moses, Alia M. Texas, W 149 1 1 1 More Junell, Robert A. Texas, W 95 2 9 2 More Brack, Robert C. N Mexico 80 3 2 25 More Olvera, Jose Rolando, Jr. Texas, S 80 3 6 - More Hanen, Andrew S. Texas, S 72 5 4 23 More Gonzales, Kenneth John N Mexico 69 6 3 - More Ramos, Nelva Gonzales Texas, S 59 7 20 49 More Crane, Randy Texas, S 50 8 5 3 More Hinojosa, Ricardo H. Texas, S 47 9 7 5 More Alvarez, Micaela Texas, S 47 9 8 8 More Table 4. Top Ten Judges
All 10 of the "top ten" judges were in districts which were in the top ten with the largest number of filings per capit.
Judge Alia M. Moses in the Western District of Texas (San Antonio) ranked 1st with 149 defendants in cases. Judge Moses appeared in the top ten rankings one year (ranked 1) and five years ago (rank 1).
Judge Robert A. Junell in the Western District of Texas (San Antonio) ranked 2nd with 95 defendants in cases. Judge Junell appeared in the top ten rankings one year (ranked 9) and five years ago (rank 2).
Judges Robert C. Brack in the District of New Mexico and Jose Rolando Olvera, Jr. in the Southern District of Texas (Houston) ranked 3rd with 80 defendants in cases. Judge Brack also appeared in the top ten rankings one year ago (ranked 2).Judge Olvera also appeared in the top ten rankings one year ago (ranked 6).
Report Generated: January 20, 2017