Prosecutions for July 2016
Referring Agency: Alcohol, Tobacco, Firearms and Explosives
The latest available data from the Justice Department show that during July 2016 the government reported 698 new prosecutions for these matters. Those cases were referred by the Alcohol, Tobacco, Firearms and Explosives. According to the case-by-case information analyzed by the Transactional Records Access Clearinghouse (TRAC), this number is up 0.9 percent over the previous month.
The comparisons of the number of defendants charged are based on case-by-case information obtained by TRAC under the Freedom of Information Act from the Executive Office for United States Attorneys (see Table 1).
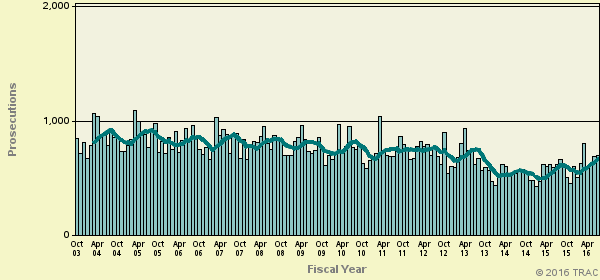
When monthly 2016 prosecutions of this type are compared with those of the same period in the previous year, the number of filings was up (14%). Prosecutions over the past year are still much lower than they were five years ago. Overall, the data show that prosecutions of this type are down 11.6 percent from levels reported in 2011.
The decrease from the levels five years ago in prosecutions for these matters is shown more clearly in Figure 1. The vertical bars in Figure 1 represent the number of prosecutions of this type recorded on a month-to-month basis. Where a prosecution was initially filed in U.S. Magistrate Court and then transferred to the U.S. District Court, the magistrate filing date was used since this provides an earlier indicator of actual trends. The superimposed line on the bars plots the six-month moving average so that natural fluctuations are smoothed out. The one and five-year rates of change in Table 1 and in the sections that follow are all based upon this six-month moving average. To view trends year-by-year rather than month-by-month, see TRAC's annual report series for a broader picture.
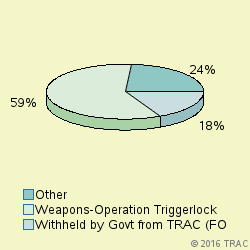
Cases were classified by prosecutors into more specific types.
The largest number of prosecutions of these matters in July 2016 was for "Weapons-Operation Triggerlock Major", accounting for 58.6 percent of prosecutions. Prosecutions were also filed for "Withheld by Govt from TRAC (FOIA challen" (17.6%), "Drugs-Drug Trafficking" (10.9%), "Drugs-Organized Crime Task Force" (6.2%), "Violence-Other" (3.7%). See Figure 2.
Prosecutions in U.S. Magistrate Courts
Top Ranked Lead Charges
In July 2016, 80 defendants in cases for these matters were filed in U.S. Magistrate Courts. These courts handle less serious misdemeanor cases, including what are called "petty offenses." In addition, complaints are sometimes filed in the magistrate courts before an indictment or information is entered. In these cases, the matter starts in the magistrate courts and later moves to the district court where subsequent proceedings take place.
In the magistrate courts in July the most frequently cited lead charge was Title 18 U.S.C Section 922 involving "Firearms; Unlawful acts". This was the lead charge for 62.5 percent of all magistrate filings in July.
Other frequently prosecuted lead charges include: "21 USC 841 - Drug Abuse Prevention & Control-Prohibited acts A" (15%), "18 USC 924 - Firearms; Penalties" (6.3%).
Prosecutions in U.S. District Courts
In July 2016, 618 defendants in new cases for these matters were charged in the U.S. District Courts. In addition during July there were an additional 72 defendants whose cases moved from the magistrate courts to the U.S. district courts after an indictment or information was filed. The sections which follow cover both sets of cases and therefore cover all matters filed in district court during July.
Top Ranked Lead Charges
Table 2 shows the top lead charges recorded in the prosecutions of matters filed in U.S. District Court during July 2016 referred by the Alcohol, Tobacco, Firearms and Explosives.
Lead Charge Count Rank 1yr ago 5yrs ago 18 USC 922 - Firearms; Unlawful acts 371 1 1 1 More 21 USC 846 - Attempt and conspiracy 50 2 3 3 More 21 USC 841 - Drug Abuse Prevention & Control-Prohibited acts A 47 3 2 2 More 18 USC 924 - Firearms; Penalties 32 4 4 4 More 18 USC 1951 - Hobbs Act 31 5 5 5 More 18 USC 371 - Conspiracy to commit offense or to defraud US 11 6 9 7 More 26 USC 5861 - Tax on Making Firearms - Prohibited acts 6 7 6 6 More 18 USC 844 - Explosives - Importation and storage of explosives 4 8 8 8 More 18 USC 1201 - Kidnaping 4 8 32 34 More 18 USC 2119 - Carjacking 3 10 10 34 More Table 2. Top Charges Filed
"Firearms; Unlawful acts" (Title 18 U.S.C Section 922) was the most frequent recorded lead charge. "Firearms; Unlawful acts" (Title 18 U.S.C Section 922) was ranked 1 a year ago, while it was ranked 1 five years ago.
Ranked 2nd in frequency was the lead charge "Attempt and conspiracy" under Title 21 U.S.C Section 846. "Attempt and conspiracy" under Title 21 U.S.C Section 846 was ranked 3 a year ago, while it was ranked 3 five years ago.
Ranked 3rd was "Drug Abuse Prevention & Control-Prohibited acts A" under Title 21 U.S.C Section 841. "Drug Abuse Prevention & Control-Prohibited acts A" under Title 21 U.S.C Section 841 was ranked 2 a year ago, while it was ranked 2 five years ago.
Among these top ten lead charges, the one showing the greatest increase in prosecutions — up 300 percent — compared to one year ago was Title 18 U.S.C Section 1201 that involves " Kidnaping ". Compared to five years ago, the largest increase — 1100 percent — was registered for prosecutions under " Carjacking " (Title 18 U.S.C Section 2119 ).
Again among the top ten lead charges, the one showing the sharpest decline in prosecutions compared to one year ago — down 24 percent — was " Explosives - Importation and storage of explosives " (Title 18 U.S.C Section 844 ). Compared to five years ago, the most significant decline in prosecutions — 38.3 percent — was for filings where the lead charge was " Tax on Making Firearms - Prohibited acts " (Title 26 U.S.C Section 5861 ).
Top Ranked Judicial Districts
In July 2016 the Justice Department said the government brought 257.6 prosecutions for every ten million people in the United States.
Understandably, there is great variation in the per capita number of prosecutions that are filed in each of the nation's ninety-four federal judicial districts.
The districts registering the largest number of prosecutions per capita for these matters last month are shown in Table 3. Districts must have at least 5 prosecutions to receive a ranking.
Judicial District Percapita Count Rank 1yr ago 5yrs ago N Mexico 3,338 58 1 44 22 More D. C. 2,856 16 2 93 90 More Tenn, W 1,753 23 3 13 16 More Ala, S 1,709 12 4 22 33 More Ga, S 1,380 18 5 31 8 More Alaska 1,005 6 6 62 61 More Okla, N 908 8 7 62 52 More N Car, M 901 22 8 3 11 More Virg, W 768 14 9 32 31 More Ind, N 742 16 10 17 24 More Table 3. Top 10 Districts (per ten million people)
The District of New Mexico — with 3338 prosecutions as compared with 257.6 prosecutions per ten million population in the United States — was the most active during July 2016.
The District of Washington, D.C. (Washington) ranked 2nd.
Western District of Tennessee (Memphis) is now ranking 3rd.
Recent entrants to the top 10 list were Western District of Tennessee (Memphis), now ranked 3rd , and Northern District of Indiana (South Bend) at 10th In the same order, these districts ranked 13th and 17th one year ago and 16th and 24th five years ago.
The federal judicial district which showed the greatest growth in the rate of prosecutions compared to one year ago — 1800 percent — was Washington, D.C. (Washington). This was the same district that had the largest increase — 216.7 percent — when compared with five years ago.
In the last year, the judicial District Court recording the largest drop in the rate of prosecutions — 32.9 percent — was Middle District of North Carolina (Greensboro). But over the past five years, Northern District of Oklahoma (Tulsa) showed the largest drop — 38.7 percent.
Top Ranked District Judges
At any one time, there are about 680 federal District Court judges working in the United States. The judges recorded with the largest number of new crime cases of this type during July 2016 are shown in Table 4.
Judge Count Rank Moss, Randolph Daniel D. C. 15 1 More Browning, James O. N Mexico 14 2 More Herrera, Judith C. N Mexico 12 3 More Harmon, Melinda Texas, S 12 3 More Wolf, Mark Lawrence Mass 11 5 More Armijo, M. Christina N Mexico 11 5 More Mays, Samuel H., Jr. Tenn, W 11 5 More Kiser, Jackson L. Virg, W 11 5 More Vazquez, Martha Alicia N Mexico 9 9 More Mueller, Kimberly Jo Cal, E 8 10 More Smith, G. R. Ga, S 8 10 More DeGuilio, Jon Ernest Ind, N 8 10 More Zobel, Rya Weickert Mass 8 10 More Brinkema, Leonie M. Virg, E 8 10 More Table 4. Top Ten Judges
A total of 9 out of the "top ten" judges were in districts which were in the top ten with the largest number of filings per capita, while the remaining 5 judges were from other districts. (Because of ties, there were a total of 14 judges in the "top ten" rankings.)
Judge Randolph Daniel Moss in the District of Washington, D.C. (Washington) ranked 1st with 15 defendants in cases.
Judge James O. Browning in the District of New Mexico ranked 2nd with 14 defendants in cases.
Judges Judith C. Herrera in the District of New Mexico and Melinda Harmon in the Southern District of Texas (Houston) ranked 3rd with 12 defendants in cases.
Report Generated: August 30, 2016