Immigration Prosecutions for January 2016
The latest available data from the Justice Department show that during January 2016 the government reported 5075 new immigration prosecutions. According to the case-by-case information analyzed by the Transactional Records Access Clearinghouse (TRAC), this number is down 17.9 percent over the previous month.
The comparisons of the number of defendants charged with immigration-related offenses are based on case-by-case information obtained by TRAC under the Freedom of Information Act from the Executive Office for United States Attorneys (see Table 1).
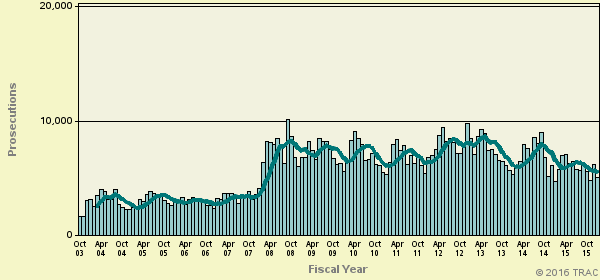
When monthly 2016 prosecutions of this type are compared with those of the same period in the previous year, the number of filings was down (-15.6%). Prosecutions over the past year are still much lower than they were five years ago. Overall, the data show that prosecutions of this type are down 9.4 percent from levels reported in 2011.
The decrease from the levels five years ago in immigration prosecutions for these matters is shown more clearly in Figure 1. The vertical bars in Figure 1 represent the number of immigration prosecutions of this type recorded on a month-to-month basis. Where a prosecution was initially filed in U.S. Magistrate Court and then transferred to the U.S. District Court, the magistrate filing date was used since this provides an earlier indicator of actual trends. The superimposed line on the bars plots the six-month moving average so that natural fluctuations are smoothed out. The one and five-year rates of change in Table 1 and in the sections that follow are all based upon this six-month moving average. To view trends year-by-year rather than month-by-month, see TRAC's annual report series for a broader picture.
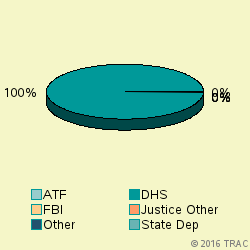
Virtually all federal criminal prosecutions for immigration offenses in January 2016 (100 percent) were referred by the Department of Homeland Security (DHS). The two lead investigative agencies in DHS are Customs and Border Protection (CBP) whose border patrol agencies guard the county's borders, and Immigration and Customs Enforcement (ICE), responsible for conducting most immigration criminal investigations under the immigration laws. See Figure 2.
Immigration Prosecutions in U.S. Magistrate Courts
Top Ranked Lead Charges
In January 2016, 4466 defendants in immigration cases for these matters were filed in U.S. Magistrate Courts. These courts handle less serious misdemeanor cases, including what are called "petty offenses." In addition, complaints are sometimes filed in the magistrate courts before an indictment or information is entered. In these cases, the matter starts in the magistrate courts and later moves to the district court where subsequent proceedings take place.
In the magistrate courts in January the most frequently cited lead charge was Title 8 U.S.C Section 1325 involving "Entry of alien at improper time or place; etc.". This was the lead charge for 64 percent of all magistrate filings in January.
Other frequently prosecuted lead charges include: "08 USC 1326 - Reentry of deported alien" (31%).
Immigration Prosecutions in U.S. District Courts
In January 2016, 609 defendants in new cases for these matters were charged in the U.S. District Courts. In addition during January there were an additional 928 defendants whose cases moved from the magistrate courts to the U.S. district courts after an indictment or information was filed. The sections which follow cover both sets of cases and therefore cover all matters filed in district court during January.
Top Ranked Lead Charges
Table 2 shows the top lead charges recorded in the prosecutions of immigration matters filed in U.S. District Court during January 2016.
Lead Charge Count Rank 1yr ago 5yrs ago 08 USC 1326 - Reentry of deported alien 1,261 1 1 1 More 08 USC 1324 - Bringing in and harboring certain aliens 178 2 2 2 More 18 USC 1546 - Fraud and misuse of visas, permits, and other documents 36 3 3 3 More 18 USC 1544 - Misuse of passport 15 4 4 6 More 08 USC 1325 - Entry of alien at improper time or place; etc. 10 5 5 4 More 21 USC 841 - Drug Abuse Prevention & Control-Prohibited acts A 7 6 20 13 More 18 USC 922 - Firearms; Unlawful acts 6 7 10 11 More 18 USC 1542 - False statement in application and use of passport 6 7 6 7 More 18 USC 758 - High speed flight from immigration checkpoint 3 9 24 - More 18 USC 1028 - Fraud and related activity - id documents 3 9 7 8 More Table 2. Top Charges Filed
"Reentry of deported alien" (Title 8 U.S.C Section 1326) was the most frequent recorded lead charge. "Reentry of deported alien" (Title 8 U.S.C Section 1326) was ranked 1 a year ago, while it was ranked 1 five years ago.
Ranked 2nd in frequency was the lead charge "Bringing in and harboring certain aliens" under Title 8 U.S.C Section 1324. "Bringing in and harboring certain aliens" under Title 8 U.S.C Section 1324 was ranked 2 a year ago, while it was ranked 2 five years ago.
Ranked 3rd was "Fraud and misuse of visas, permits, and other documents" under Title 18 U.S.C Section 1546. "Fraud and misuse of visas, permits, and other documents" under Title 18 U.S.C Section 1546 was ranked 3 a year ago, while it was ranked 3 five years ago.
Among these top ten lead charges, the one showing the greatest increase in prosecutions — up 525 percent — compared to one year ago was Title 21 U.S.C Section 841 that involves " Drug Abuse Prevention & Control-Prohibited acts A ". Compared to five years ago, the largest increase — 86.7 percent — was registered for prosecutions under " Misuse of passport " (Title 18 U.S.C Section 1544 ).
Again among the top ten lead charges, the one showing the sharpest decline in prosecutions compared to one year ago — down 53.3 percent — was " Entry of alien at improper time or place; etc. " (Title 8 U.S.C Section 1325 ). This was the same statute that had the largest decrease — 78.3 % — when compared with five years ago.
Top Ranked Judicial Districts
Understandably, there is great variation in the number of immigration prosecutions that are filed in each of the nation's ninety-four federal judicial districts.
The districts registering the largest number of prosecutions of this type last month are shown in Table 3.
The Southern District of Texas (Houston) — with 363 prosecutions — was the most active during January 2016. The Southern District of Texas (Houston) was ranked 1 a year ago, while it was ranked 1 for most frequent use five years ago.
The District of Arizona ranked 2nd. The District of Arizona was ranked 3 a year ago, while it was ranked 2 for most frequent use five years ago.
District of New Mexico is now ranking 3rd. The District of New Mexico was ranked 4 a year ago, while it was ranked 5 for most frequent use five years ago.
Recent entrants to the top 10 list were Middle District of Florida (Tampa), now ranked 10th , and South Carolina at 9th In the same order, these districts ranked 11th and 15th one year ago and 11th and 46th five years ago.
The federal judicial district which showed the greatest growth in immigration prosecutions compared to one year ago — 20.6 percent — was Utah . Compared to five years ago, the district with the largest growth — 84.7 percent — was New Mexico .
In the last year, the judicial District Court recording the largest drop in immigration prosecutions — 45 percent — was South Carolina . But over the past five years, Southern District of California (San Diego) showed the largest drop — 57.3 percent.
Top Ranked District Judges
At any one time, there are about 680 federal District Court judges working in the United States. The judges recorded with the largest number of new immigration crime cases of this type during January 2016 are shown in Table 4.
Judge Count Rank 1yr ago 5yrs ago Brack, Robert C. N Mexico 114 1 2 1 More Moses, Alia Texas, W 110 2 1 6 More Gonzales, Kenneth John N Mexico 93 3 3 - More Ramos, Nelva Gonzales Texas, S 50 4 8 - More Alvarez, Micaela Texas, S 42 5 7 3 More Crane, Randy Texas, S 35 6 6 4 More Hanen, Andrew S. Texas, S 35 6 4 14 More Hinojosa, Ricardo H. Texas, S 34 8 5 5 More Rainey, John David Texas, S 29 9 22 21 More Head, Hayden Wilson, Jr. Texas, S 24 10 63 34 More Table 4. Top Ten Judges
All 10 of the "top ten" judges were in districts which were in the top ten with the largest number of immigration filings.
Judge Robert C. Brack in the District of New Mexico ranked 1st with 114 defendants in immigration cases. Judge Brack appeared in the top ten rankings one year (ranked 2) and five years ago (rank 1).
Judge Alia Moses in the Western District of Texas (San Antonio) ranked 2nd with 110 defendants in immigration cases. Judge Moses appeared in the top ten rankings one year (ranked 1) and five years ago (rank 6).
Judge Kenneth John Gonzales in the District of New Mexico ranked 3rd with 93 defendants in immigration cases. Judge Gonzales also appeared in the top ten rankings one year ago (ranked 3).
Report Generated: March 23, 2016